这个其实和上一篇柱状图差不多,只是用了另一个函数,这里主要介绍下上一篇没有说到的东西。
函数介绍
matplotlib.pyplot.barh(bottom, width, height=0.8, left=None, hold=None, **kwargs)


Make a horizontal bar plot.


Make a horizontal bar plot with rectangles bounded by:


    left, left + width, bottom, bottom + height

        (left, right, bottom and top edges)
由于是横向的条形图,所有参数会有些变化,比如这里,默认height是0.8
来一个基本小例子
import matplotlib.pyplot as plt
import numpy as np
plt.rcParams['font.sans-serif']=['SimHei'] #用来正常显示中文标签
plt.rcParams['axes.unicode_minus']=False #用来正常显示负号
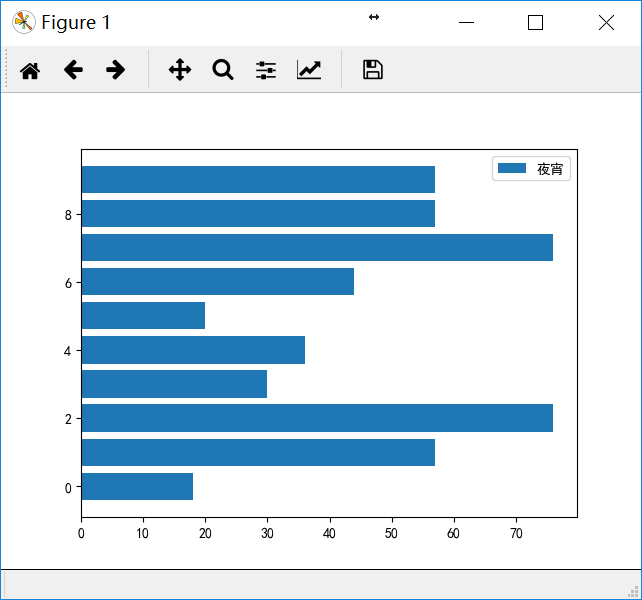
data = np.random.randint(10,100,size=10)
plt.barh(np.arange(data.size), data, label='夜宵')
plt.legend()
plt.show()
下面,我们来看几个之前没有用过的函数
matplotlib.pyplot.xticks(*args, **kwargs)

Get or set the x-limits of the current tick locations and labels.


matplotlib.pyplot.yticks(*args, **kwargs)

Get or set the y-limits of the current tick locations and labels.
这2个函数,可以设置x轴和y轴的标签和坐标长度及间距,还是很好玩儿的
#x轴从0到100,间距10
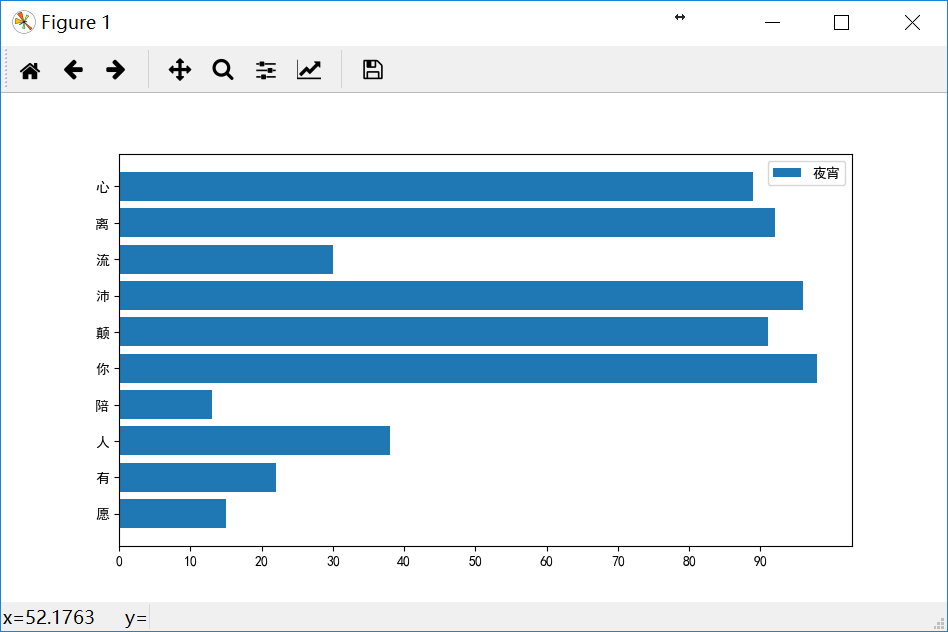
plt.xticks(np.arange(0,100,10))
#y轴使用中文替换
plt.yticks(np.arange(data.size),('愿','有','人','陪','你','颠','沛','流','离','心'))
下面说2个暂时还不知道咋用的参数,
xerr : scalar or array-like, optional, default: None

if not None, will be used to generate errorbar(s) on the bar chart


yerr : scalar or array-like, optional, default: None

if not None, will be used to generate errorbar(s) on the bar chart
在网上查了一圈,应该是叫“误差棒”,说实在散布图中,注明所测量数据的不确定度的大小。
这里先混个眼熟吧,后面等明白咋用了,再说下
plt.barh(np.arange(data.size), data, label='夜宵', xerr=2, yerr=0.5,ecolor='red')
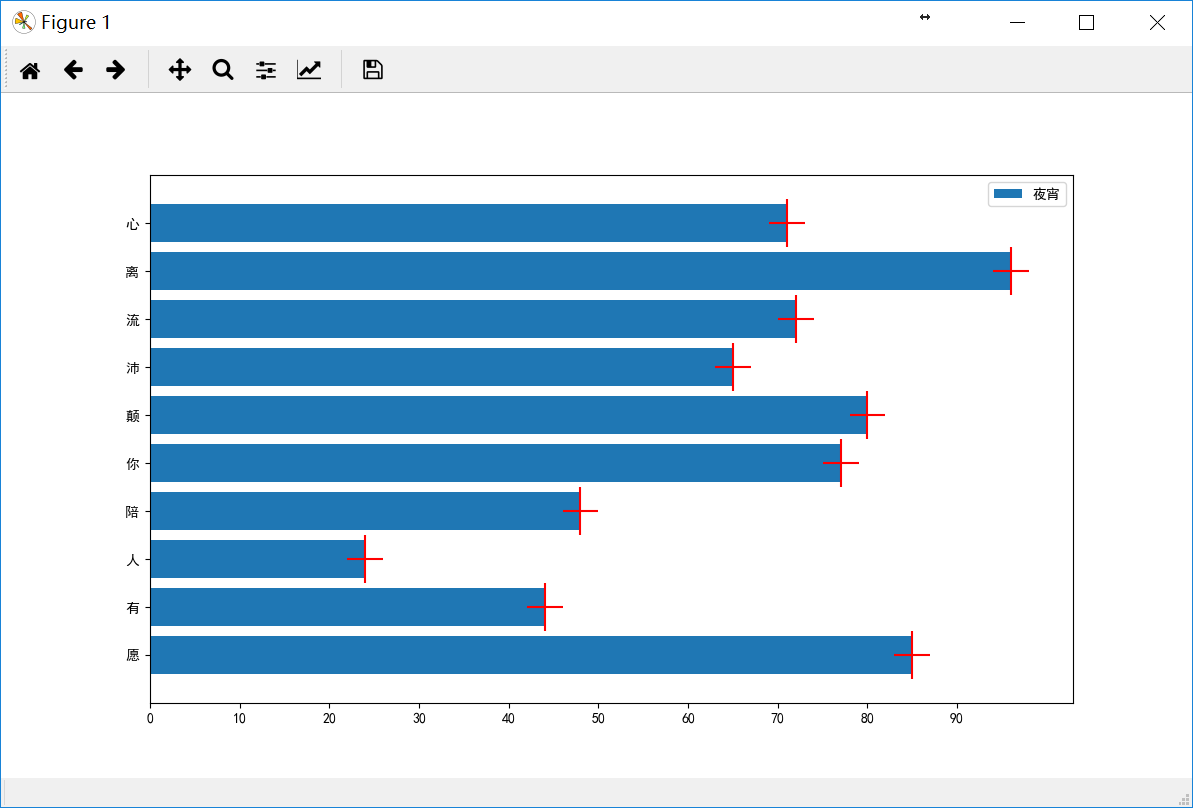
这些十字线,就是绘制的“误差棒”
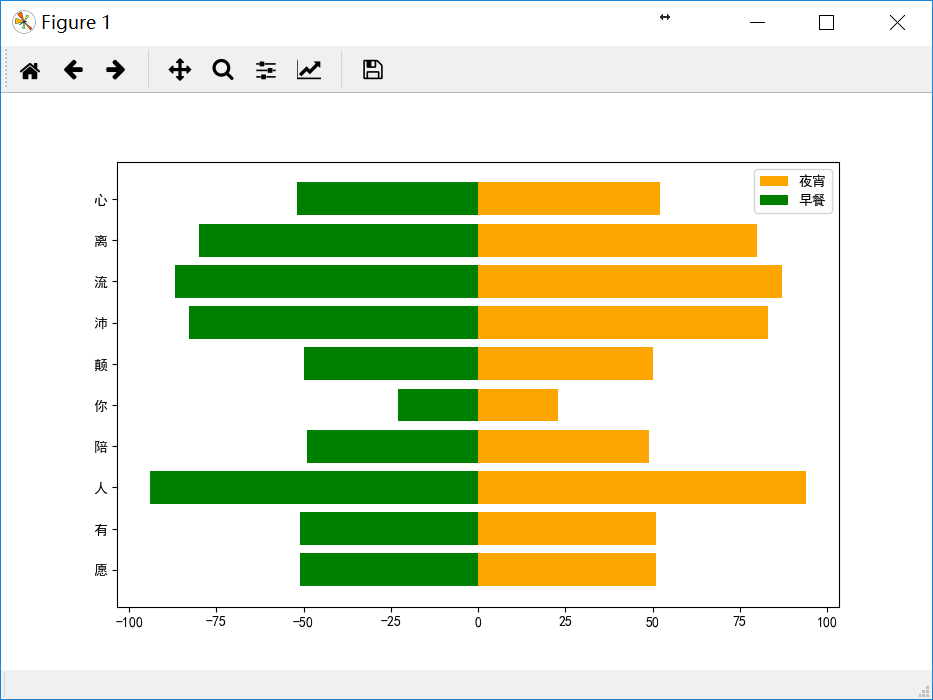
下面,我们试一个对照图,我们将x轴变成负的
plt.barh(np.arange(data.size), data, label='夜宵',color='orange')


plt.barh(np.arange(data.size), -data, label='早餐',color='green')
先到这吧,网有点儿卡,看看明天再加些其他内容
