昨天学习了figure、subplot,最后还说了些常用的方法。
这里先简单总结下文本相关的函数使用,算是昨天最后一个部分的补充。
1.pyplot.plot
我们先来看下,这个plot函数,之前呢,绘图的时候,一直都是使用这个函数, 貌似没说这个函数到底干啥的。
matplotlib.pyplot.plot(*args, **kwargs)


Plot lines and/or markers to the Axes. args is a variable length argument, allowing for multiple x, y pairs with an optional format string. For example, each of the following is legal:
就是说,这个plot函数呢,可以在axes上绘制线条或者标记;
我们呢,可以直接使用pyplot.plot函数去在当前的Axes上绘图(我们之前应该主要使用这种方法),
也可以获取当前Axes,然后通过Axes去绘图
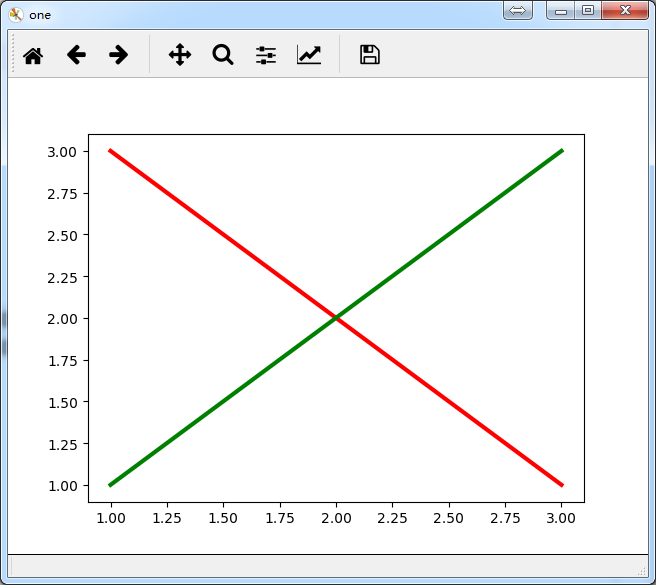
import matplotlib.pyplot as plt


#手动创建一个figure,标题为"one"

f1 = plt.figure('one')


#获取当前axes

current_axes = plt.gca()


#使用axes绘图

current_axes.plot([1,2,3],[3,2,1],color='red',label='lable1',linewidth=3)

current_axes.plot([1,2,3],[1,2,3],color='green',label='label2',linewidth=3)


print(type(current_axes))


plt.show()
2. 常用文本函数
下面,我们就介绍下Text相关的函数,参考文档:http://matplotlib.org/users/text_intro.html
text() #在任意坐标轴位置,添加文字 matplotlib.axes.Axes.text()
figtext() #matplotlib.figure.Figure.text() Add text to figure at location x, y (relative 0-1 coords)
Axes.text(x, y, s, fontdict=None, withdash=False, **kwargs)
#这里记录几个常用的参数
#这2个主要是控制文本的位置,大家试一下知道啥意思了
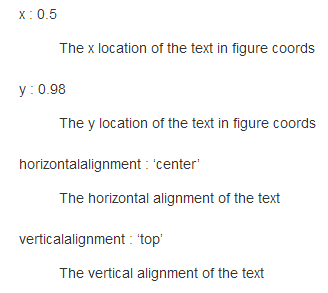
horizontalalignment #[ ‘center’ | ‘right’ | ‘left’ ],水平位置
verticalalignment #[ ‘center’ | ‘top’ | ‘bottom’ | ‘baseline’ ],垂直位置
一个小例子
current_axes.text(2,1,'hahaha',fontsize=20)
默认位置,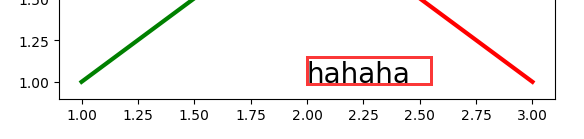
我们修改下参数
#设置水平居中,文字会在指定的坐标出,进行居中

current_axes.text(2,1,'hahaha',fontsize=20,horizontalalignment='center')
还有一个参数,他可以将文字用框框起来,bbox的value是dic,指定矩形的属性就行,
bbox #FancyBboxPatch prop dict bbox is a dictionary of Rectangle properties.
小例子
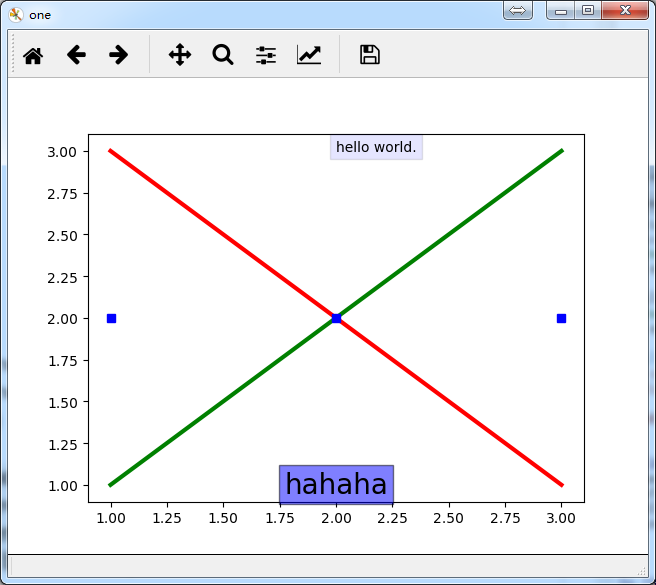
current_axes.text(2,3,'hello world.',bbox=dict(facecolor='blue', alpha=0.1))

current_axes.text(2,1,'hahaha',fontsize=20,horizontalalignment='center',

                  verticalalignment='center',

                  bbox=dict(facecolor='blue', alpha=0.5))
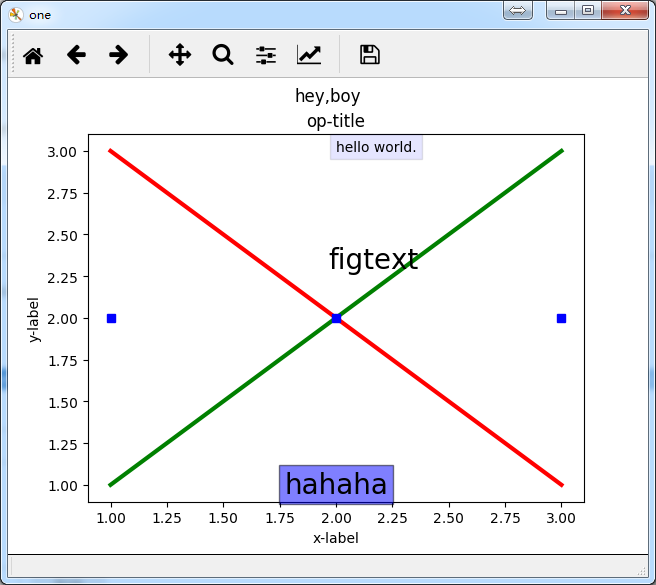
上面,还有一个figtext()函数,和text()差不多,只不过,他是相对于figure来说的,主要是相对位置,x,y是0-1的值
plt.figtext(0.5,0.6,'figtext',fontsize=20)

下面,我们继续说常用的文本函数,有些,我们已经用过了
xlabel() #x轴标签 matplotlib.axes.Axes.set_xlabel()

ylabel() #y轴标签 matplotlib.axes.Axes.set_ylabel()

title() #给轴添加标题 matplotlib.axes.Axes.set_title()
小例子
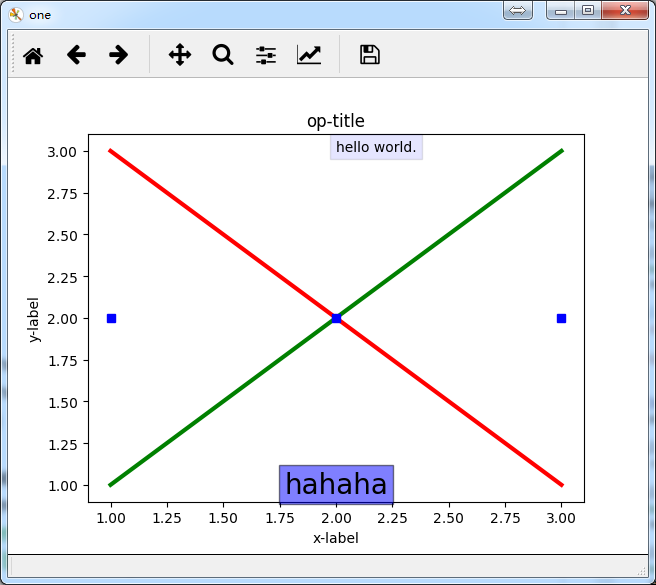
current_axes.set_xlabel('x-label')

current_axes.set_ylabel('y-label')

current_axes.set_title('op-title')
我们继续,还有一个suptitle(),他会在figure的中间位置,添加一个标题
suptitle() #add a title to the Figure; matplotlib.figure.Figure.suptitle()
他有很多的默认参数
plt.suptitle('hey,boy')
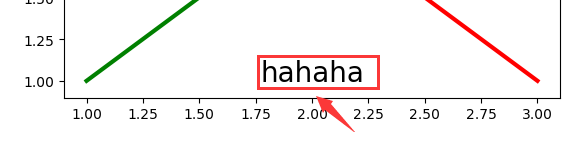
再看最后一个函数
#add an annotation, with optional arrow, to the Axes ; matplotlib.axes.Axes.annotate()

annotate()


#xy指向的坐标,xytext文本坐标,arrowprops定义箭头格式

current_axes.annotate('look!!',xy=(2,2),xytext=(2.5,1.75),

                      arrowprops=dict(facecolor='black', shrink=0.05))
好了,文本相关的函数就介绍到这,整理完以后,感觉还是有太多太多内容,还是得多练习。
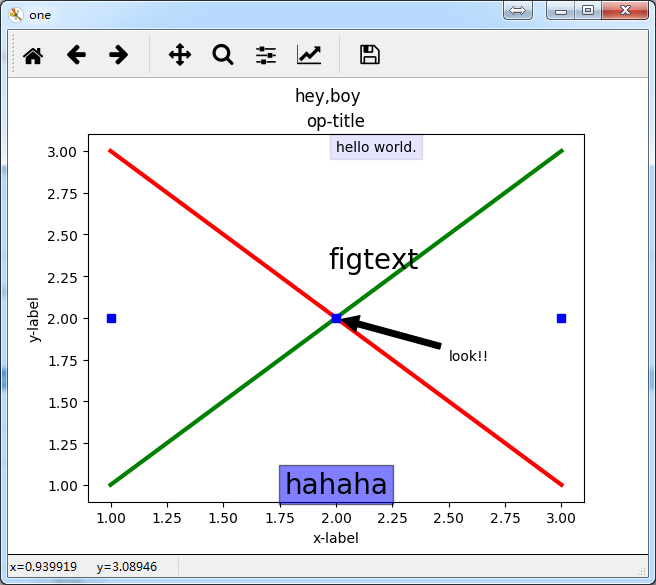
完整练习代码:
import matplotlib.pyplot as plt


#手动创建一个figure,标题为"one"

f1 = plt.figure('one')


#获取当前axes

current_axes = plt.gca()


plt.figtext(0.5,0.6,'figtext',fontsize=20)

plt.suptitle('hey,boy')


#使用axes绘图

current_axes.plot([1,2,3],[3,2,1],color='red',label='lable1',linewidth=3)

current_axes.plot([1,2,3],[1,2,3],color='green',label='label2',linewidth=3)

current_axes.plot([1,2,3],[2,2,2],'bs')


current_axes.text(2,3,'hello world.',bbox=dict(facecolor='blue', alpha=0.1))

current_axes.text(2,1,'hahaha',fontsize=20,horizontalalignment='center',

                  verticalalignment='center',

                  bbox=dict(facecolor='blue', alpha=0.5))


current_axes.set_xlabel('x-label')

current_axes.set_ylabel('y-label')

current_axes.set_title('op-title')


#xy指向的坐标,xytext文本坐标,arrowprops定义箭头格式

current_axes.annotate('look!!',xy=(2,2),xytext=(2.5,1.75),

                      arrowprops=dict(facecolor='black', shrink=0.05))


print(type(current_axes))


plt.show()
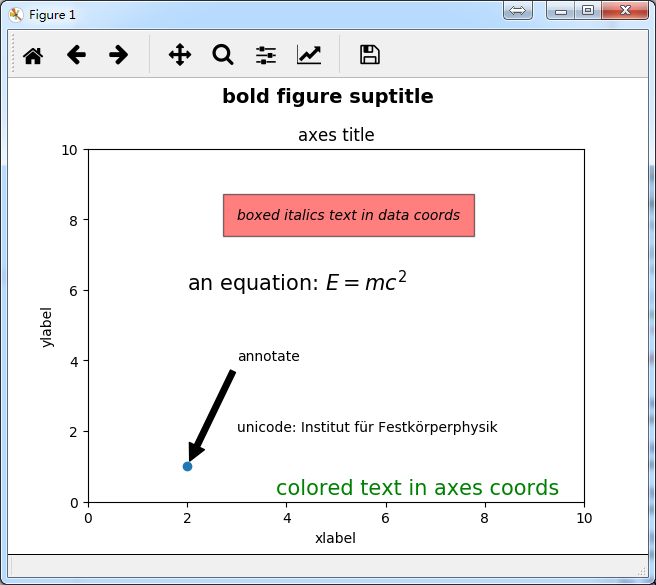
官网上还有一个例子代码,这里也复制一下,同学们可以去官网看详细的介绍:
# -*- coding: utf-8 -*-

import matplotlib.pyplot as plt


fig = plt.figure()

fig.suptitle('bold figure suptitle', fontsize=14, fontweight='bold')


ax = fig.add_subplot(111)

fig.subplots_adjust(top=0.85)

ax.set_title('axes title')


ax.set_xlabel('xlabel')

ax.set_ylabel('ylabel')


ax.text(3, 8, 'boxed italics text in data coords', style='italic',

        bbox={'facecolor':'red', 'alpha':0.5, 'pad':10})


ax.text(2, 6, r'an equation: $E=mc^2$', fontsize=15)


ax.text(3, 2, u'unicode: Institut f\374r Festk\366rperphysik')


ax.text(0.95, 0.01, 'colored text in axes coords',

        verticalalignment='bottom', horizontalalignment='right',

        transform=ax.transAxes,

        color='green', fontsize=15)


ax.plot([2], [1], 'o')

ax.annotate('annotate', xy=(2, 1), xytext=(3, 4),

            arrowprops=dict(facecolor='black', shrink=0.05))


ax.axis([0, 10, 0, 10])


plt.show()