这里,我们继续上一节,继续学习下pyplot
参考官方文档:http://matplotlib.org/2.0.2/users/pyplot_tutorial.html
1. pyplot.figure
我暂时是把他理解成画板的意思,前面我们虽然没有使用figure,但是默认会创建一个figure
matplotlib.pyplot.figure(num=None, figsize=None, dpi=None, facecolor=None, edgecolor=None, frameon=True, FigureClass=<class 'matplotlib.figure.Figure'>, **kwargs)


#这里有几个常用的参数,比如num,这就好比是一个id,来表示每一个figure

num : integer or string, optional, default: none

#画板的大小

figsize : tuple of integers, optional, default: None

#表示画板的背景颜色

facecolor :the background color. If not provided, defaults to rc figure.facecolor
我们来个小例子,我们就创建3个figure,修改背景颜色,不做其他的
import matplotlib.pyplot as plt


plt.figure('one' ,facecolor='green')


plt.figure('two' ,facecolor='red')


plt.figure('three' ,facecolor='blue')


plt.show()
上面,我们新建3个figure,名字分别是“one”,“two”,“three”,执行后,会看到这3个figure
不同的画板,我们可以在上面画不同的图
import matplotlib.pyplot as plt


plt.figure('one')


plt.plot([1,2,3] , [3,5,1])


plt.figure('two')

plt.plot([1,2,3] , [3,5,1],'ro')


#plt.figure('three' ,facecolor='blue')


plt.show()
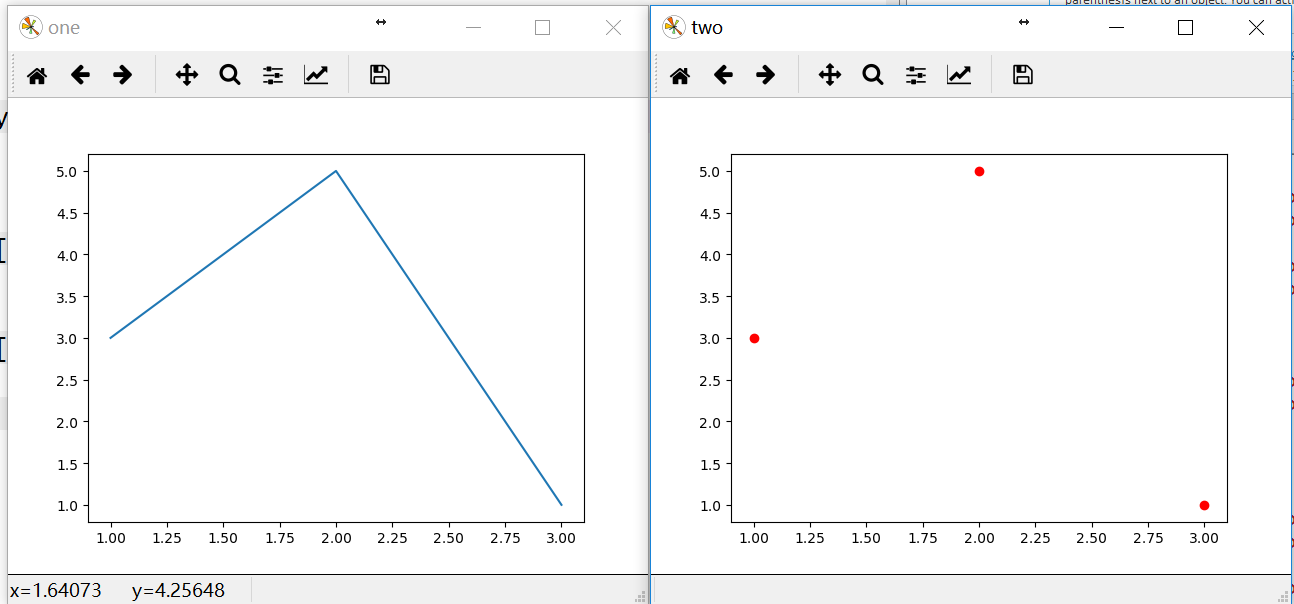
有的时候,我们只是想在一个画板上,显示多个图,比如上面这个,我们想在一个figure上显示
这时候,我们需要用到另一个函数
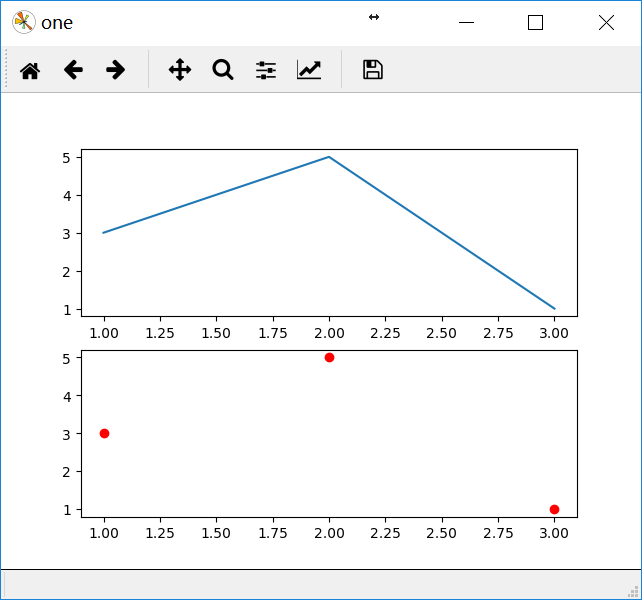
2. pyplot.subplot
matplotlib.pyplot.subplot(*args, **kwargs)


#plot_number starts at 1

subplot(nrows, ncols, plot_number)
这个函数不知道翻译成什么,大概的意思,就是说把figure分割成了几块,nrows:多少行,ncols:多少列,plot_number:编号;
这里面有一个轴的概念,因为每个图都有自己的横纵坐标,这里也说是把figure分成了nrows*ncols 个子轴
import matplotlib.pyplot as plt


plt.figure('one')


#2行1列,第1个

plt.subplot(2,1,1)

plt.plot([1,2,3] , [3,5,1])


#2行1列,第2个

plt.subplot(2,1,2)

plt.plot([1,2,3] , [3,5,1],'ro')


plt.show()
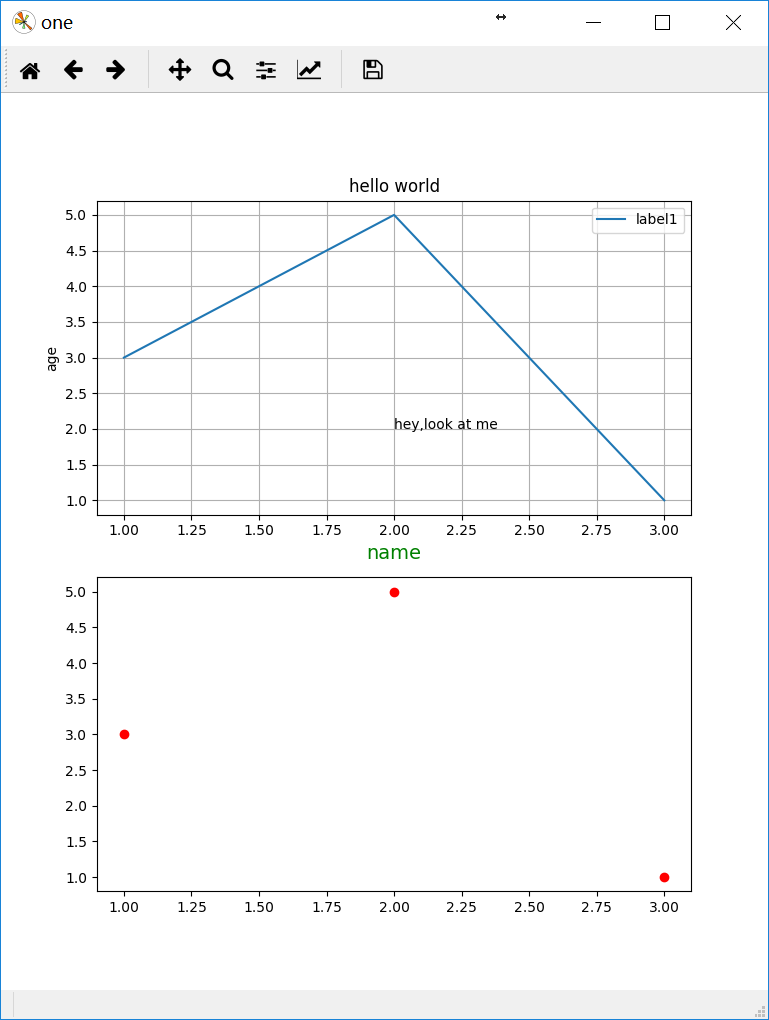
3. pyplot常用方法
下面,我们补充下pyplot的一些常用方法
import matplotlib.pyplot as plt


plt.figure('one')


#2行1列,第1个

plt.subplot(2,1,1)

plt.plot([1,2,3] , [3,5,1],label='label1')


#添加x轴标题

plt.xlabel('name',fontsize=14, color='green')

#添加y轴标题

plt.ylabel('age')

#添加标题

plt.title('hello world')

#添加文本注释

plt.text(2, 2, 'hey,look at me')


#显示图例

plt.legend()


#显示网格线

plt.grid(True)


#2行1列,第2个

plt.subplot(2,1,2)

plt.plot([1,2,3] , [3,5,1],'ro')


plt.show()
上面的text函数,可以添加文本标记,还有一个更好用的函数annotate,
plt.annotate('local max', xy=(1.25, 3), xytext=(3, 1.5),

            arrowprops=dict(facecolor='black', shrink=0.05),

            )

这些函数,实在太多,功能太强大了,得慢慢来消化,多使用。
