
作者:厚缊,中观经济咨询助理研究员,业余数据科学爱好者。博客:houyun.xyz
上篇:诹图系列(1): 简单条形图,这一篇文章主要解决如何用基础绘图系统绘制长标签条形图,再拓展到按照其他因子分类的叠加条形图。
长标签条形图
按照惯例,先上效果图。
数据及标签
原书作者没有提供ZA4753的原始数据,只能根据原图来手动整理。
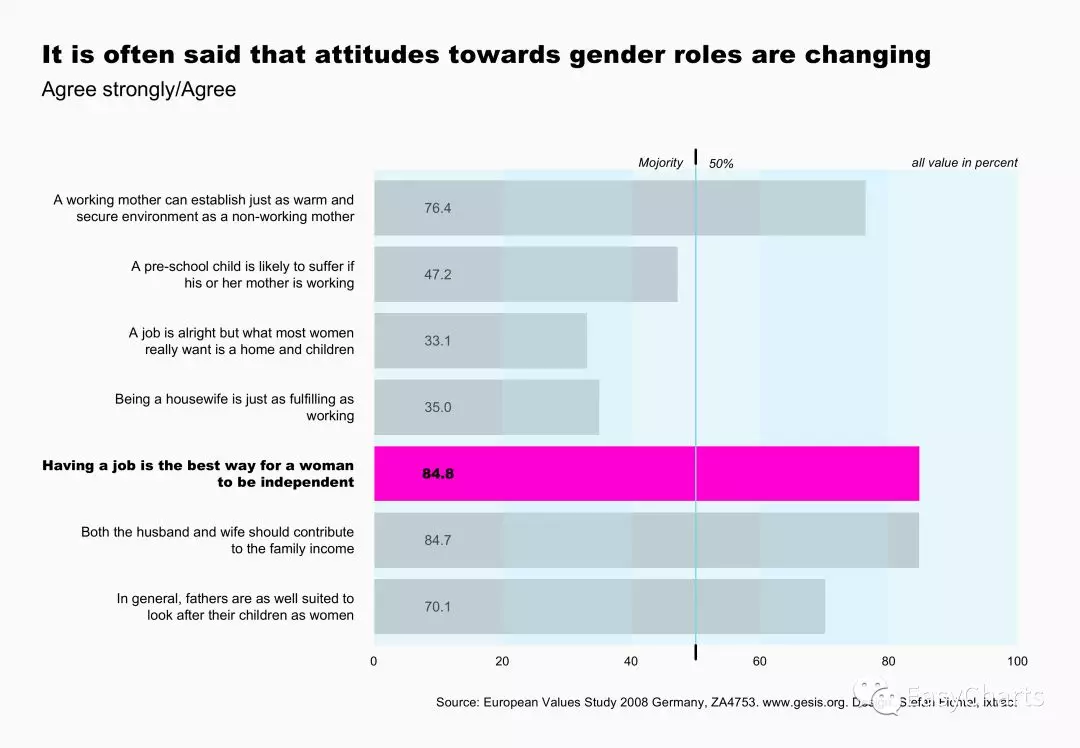
## 条形的长度bar_data <- c(70.1, 84.7, 84.8, 35, 33.1, 47.2, 76.4)## 条形标签,不能放在一行的需要用“\n”手动换行myC_v159 <- "A working mother can establish just as warm and\nsecure environment as a non-working mother"myC_v160 <- "A pre-school child is likely to suffer if\nhis or her mother is working"myC_v161 <- "A job is alright but what most women\nreally want is a home and children"myC_v162 <- "Being a housewife is just as fulfilling as\nworking"myC_v163 <- "Having a job is the best way for a woman\nto be independent"myC_v164 <- "Both the husband and wife should contribute\nto the family income"myC_v165 <- "In general, fathers are as well suited to\nlook after their children as women"myC_v166 <- "Men should take as much responsibility\nas women for their household and children"names <- c(myC_v165, myC_v164, myC_v163, myC_v162, myC_v161, myC_v160, myC_v159)
图形设备
与前面的例子相同,继续使用cairo_pdf图形设备,背景色设置为grey98(98度灰)。因为本例条形标签比较长,需要占用较大的区域,所以图形宽度设置为13英寸。
barchart02 <- "your/figure/path/barcharts_simple.pdf"cairo_pdf(filename = barchart02, bg = "grey98", width = 13, height = 9)
全局绘图参数
mai第二个值,即左边绘图区边距设置为4英寸,保证条形标签不超出绘图区。
opar <- par()par(omi = c(0.75, 0.5, 1.2, 0.75),mai = c(0.35, 4, 0.75, 0),mgp = c(3, 3, 0),family = 'Arial')
主图及标签
主图设置和前例相同,不做过多解释。重点是标签部分,从图中发现第三个条形的颜色是品红色,标签是黑体,与其他条形存在明显的区别,所以为了避免后面叠加的品红色条形覆盖标签,这里先只标出正常字体的标签。
# 主图y <- barplot(bar_data, col = 'grey', border = NA,              horiz = TRUE, names.arg = FALSE, axes = FALSE,             xlim = c(0, 100))
# 标签font_name <- ifelse(1:7 == 3, 'Arial Black', 'Arial')for (i in 1:7) {if(i == 3) next()  text(-3, y[i], labels = names[i], xpd = TRUE,        adj = 1, family = font_name[i])  text(10, y[i], labels = format(bar_data[i], nsmall = 1), adj = 0.5,       family = font_name[i])}
背景色与特定条形高亮
背景是将X轴等分为5份,Y轴稍微超过坐标范围的矩形,填充色是半透明的浅蓝色。rect()函数用左下角(xleft,ybottom)和右上角(xright,ytop)两个点确定一个矩形,当点坐标为向量时,绘制多个矩形。因此,使用点坐标向量的形式,可以一次绘制5个矩形,并分别制定每个矩形填充色。
xleft <- seq(0, 80, length.out = 5)xright <- seq(20, 100, length.out = 5)ybottom <- rep(0, 5)ytop <- rep(8.6, 5)bg_col <- ifelse(1:5 %% 2 == 1, rgb(191,239,255,80, maxColorValue=255), rgb(191,239,255,120, maxColorValue=255))rect(xleft, ybottom, xright, ytop, border = NA, col = bg_col)
将第三个条形绘制成高亮的品红色,方案就是除了第三个,其他条形长度设置为0,绘制颜色为品红的条形图并叠加到原条形上,然后为第三个条形添加黑体的标签。
bar_high_light <- ifelse(1:7 == 3, bar_data, 0)barplot(bar_high_light, horiz = TRUE, names.arg = FALSE, border = FALSE,col = rgb(255, 0, 210, maxColorValue = 255), axes = FALSE,add = TRUE)text(-3, y[3], labels = names[3], xpd = TRUE,adj = 1, family = font_name[3])text(10, y[3], labels = format(bar_data[3], nsmall = 1), adj = 0.5,family = font_name[3])
其他细节图形标记
其他图形细节和前例几乎没有差别,不一一进行解释。
arrows(50, 0, 50, 8.7, lwd = 1.5, col = 'skyblue', length = 0, xpd = TRUE)arrows(50, -0.25, 50, 0, lwd = 3, col = 'black', length = 0, xpd = TRUE)arrows(50, 8.7, 50, 8.95, lwd = 3, col = 'black', length = 0, xpd = TRUE)text(48, 8.7, labels = 'Mojority', adj = 1, cex = 0.9,      font = 3, xpd = TRUE)text(52, 8.7, labels = '50%', adj = 0, cex = 0.9,      font = 3, xpd = TRUE)text(100, 8.7, labels = 'all value in percent', adj = 1,      cex = 0.9, font = 3, xpd = TRUE)mtext(seq(0, 100, length.out = 6),       at = seq(0, 100, length.out = 6), side = 1,      line = 0, cex = 0.9)mtext('It is often said that attitudes towards gender roles are changing',      side = 3, line = 2, cex = 1.8, adj = 0,       family = 'Arial Black', outer = TRUE)mtext('Agree strongly/Agree', side = 3, line = 0, cex = 1.5,       adj = 0, outer = TRUE)mtext('Source: European Values Study 2008 Germany, ZA4753. www.gesis.org. Design: Stefan Fichtel, ixtract',      side = 1, line = 0.7, adj = 1, cex = 0.9,       outer = TRUE)dev.off()
par(opar)
堆叠条形图
这一列只放效果图和代码,有兴趣可以自己动手绘制。
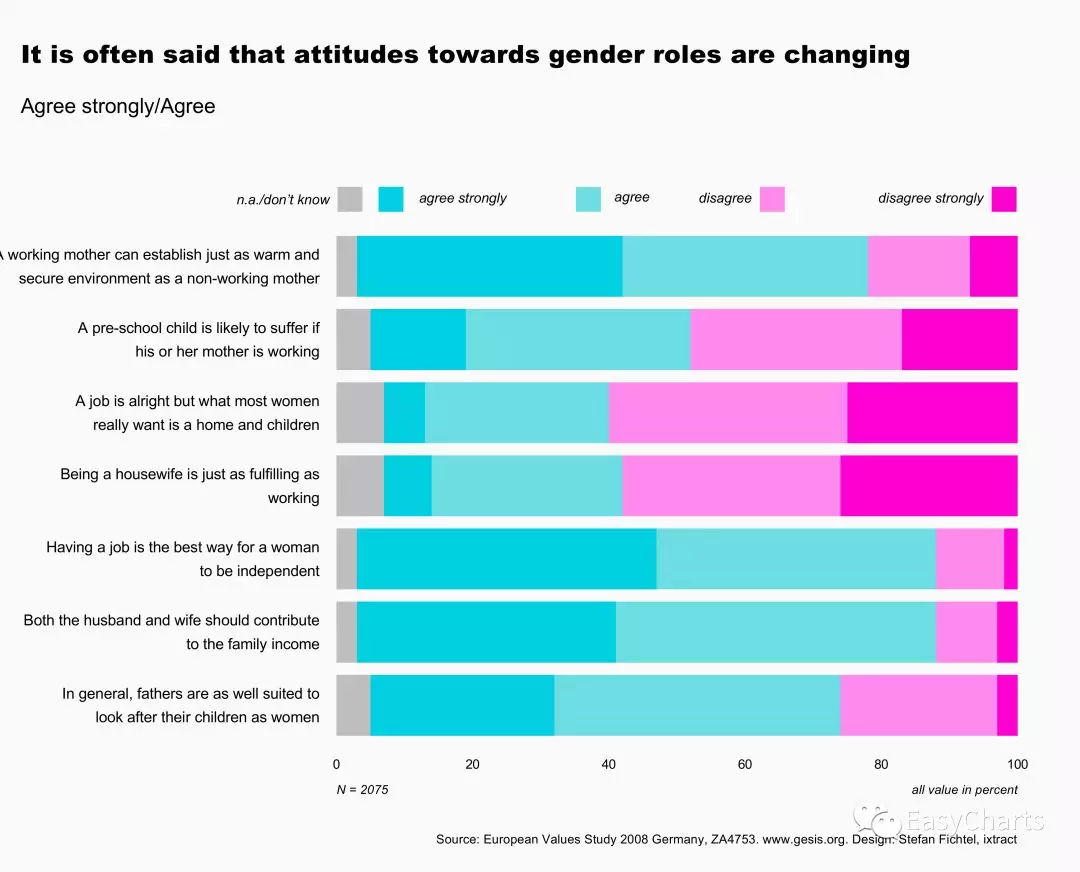
barchart03 <- 'your/figure/path/barcharts_simple.pdf'cairo_pdf(barchart03, bg = 'grey98', width = 13, height = 10.5)data <- c(5,27,42,23,3,3,38,47,9,3,3,44,41,10,2,7,7,28,32,26,7,6,27,35,25,5,14,33,31,17,3,39,36,15,7)za4753 <- t(matrix(data, nrow = 7, byrow = TRUE))responses <- c("n.a./don’t know", "agree strongly", "agree", "disagree", "disagree strongly")opar <- par()par(mai = c(1.4, 3.8, 0.5, 0),omi = c(0, 0.25, 2.1, 0.75),family = 'Arial',lheight = 1.3,las = 1)# labelsmyC_v159 <- "A working mother can establish just as warm and\nsecure environment as a non-working mother"myC_v160 <- "A pre-school child is likely to suffer if\nhis or her mother is working"myC_v161 <- "A job is alright but what most women\nreally want is a home and children"myC_v162 <- "Being a housewife is just as fulfilling as\nworking"myC_v163 <- "Having a job is the best way for a woman\nto be independent"myC_v164 <- "Both the husband and wife should contribute\nto the family income"myC_v165 <- "In general, fathers are as well suited to\nlook after their children as women"myC_v166 <- "Men should take as much responsibility\nas women for their household and children"names <- c(myC_v165, myC_v164, myC_v163, myC_v162, myC_v161, myC_v160, myC_v159)# 主图## 颜色col01 <- rgb(0,208,226, maxColorValue =255)col02 <- rgb(109,221,225, maxColorValue =255)col03 <- rgb(255,138,238, maxColorValue =255)col04 <- rgb(255,0,210, maxColorValue =255)col_name <- c('grey', col01, col02, col03, col04)##绘图y <- barplot(za4753, names.arg = names, border = NA, horiz = TRUE,col = col_name, axes = FALSE, xlim = c(0, 100), cex.names = 1.1)#其它绘图元素xl_mark <- c(2, 8, 37, 64, 98)yl_mark <- rep(9.0, 5)xl_lab <- c(-1, 25, 46, 61, 95)yl_lab <- rep(9.0, 5)points(xl_mark, yl_mark, pch = 15, cex = 4, col = col_name, xpd = TRUE)text(xl_lab, yl_lab, labels = responses, adj = 1, xpd = TRUE, font = 3)x_label <- c(0, 20, 40, 60, 80, 100)mtext(x_label, side = 1, at = x_label, line = 0, cex = 0.95)mtext('It is often said that attitudes towards gender roles are changing',side = 3, line = 6.5, cex = 1.8, adj = 0, family = 'Arial Black', outer = TRUE)mtext('Agree strongly/Agree', side = 3, line = 3.5, cex = 1.5, adj = 0, outer = TRUE)mtext('Source: European Values Study 2008 Germany, ZA4753. www.gesis.org. Design: Stefan Fichtel, ixtract',side = 1, line = 4.5, adj = 1, cex = 0.9)mtext('all value in percent', side = 1, line = 1.5, cex = 0.9, adj = 1, font = 3)mtext('N = 2075', side = 1, line = 1.5, cex = 0.9, adj = 0, font = 3)dev.off()par(opar)
——————————————
往期精彩:
 天善智能每日一道算法题,打卡学习
 小程序
小程序