作者简介
taoyan:R语言中文社区特约作家,伪码农,R语言爱好者,爱开源。
个人博客: https://ytlogos.github.io/

这节课作者命名为”Tweaking everything in a plot”。主要是对图形细节进行优化,包括:
- 题目(title)、坐标轴标签、图例标签等
- 字体
- 颜色
- 背景
- 网格线等
数据加载及清洗
这部分在上节课已经讲过了,这里就不再详述了。
library(tidyverse)

library(plyr)

my_data <- read.csv("Encode_HMM_data.txt", sep = "\t", header = FALSE)

names(my_data)[1:4] <- c("chrom","start","stop","type")

my_data$chrom <- factor(gsub("chr","", my_data$chrom, fixed = TRUE), levels = c(seq(1:22),"X","Y"))

my_data <- my_data[my_data$type %in% c("1_Active_Promoter","4_Strong_Enhancer","8_Insulator"), ]

my_data$type <- revalue(my_data$type, c("1_Active_Promoter"="Promoter", "4_Strong_Enhancer"="Enhancer","8_Insulator"="Insulator"))
可视化
接下来就针对图形进行优化调整
ggplot(my_data, aes(x=chrom, fill=type))+geom_bar()

添加标题
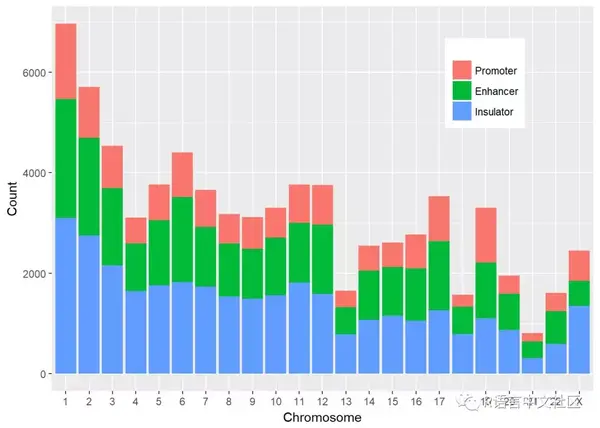
ggplot(my_data, aes(x=chrom, fill=type))+geom_bar()+labs(title="Regulatory features by chromosomes")
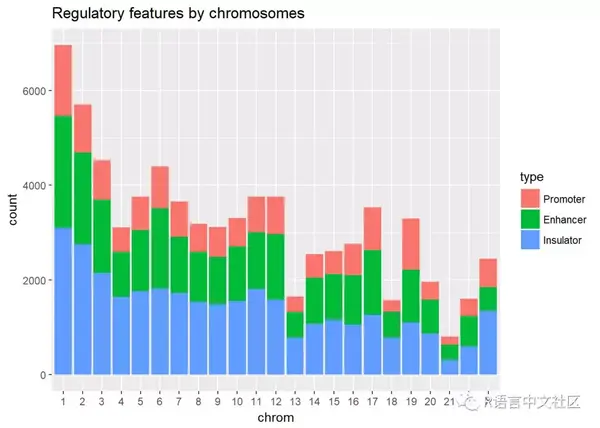
需要注意的一点是,添加的title默认是位于左上角,如果要居中显示的话最简单的办法就是在标题前添加空格。
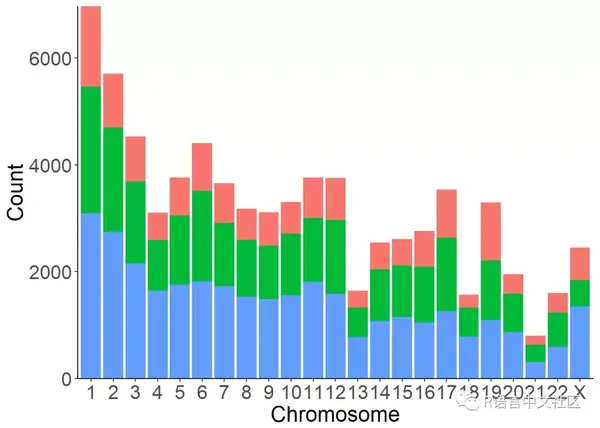
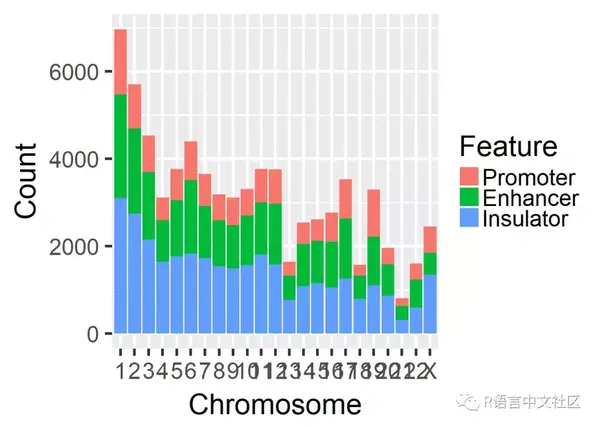
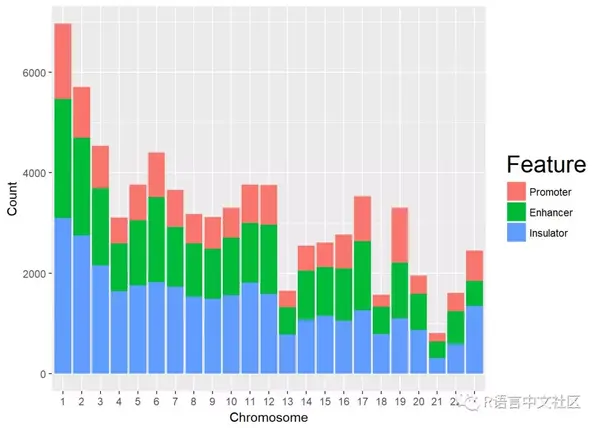
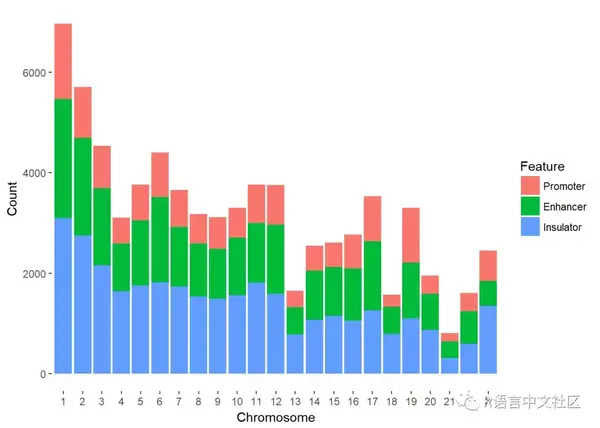
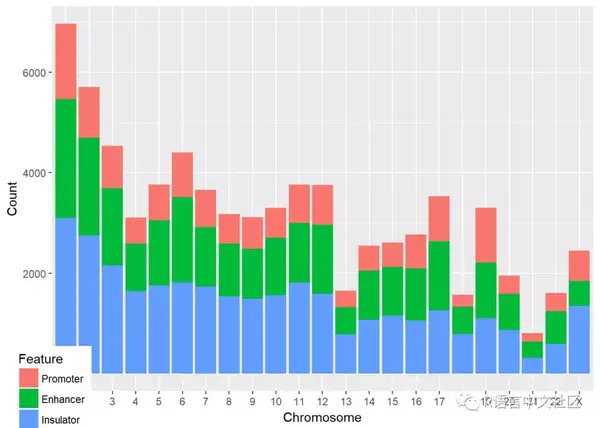
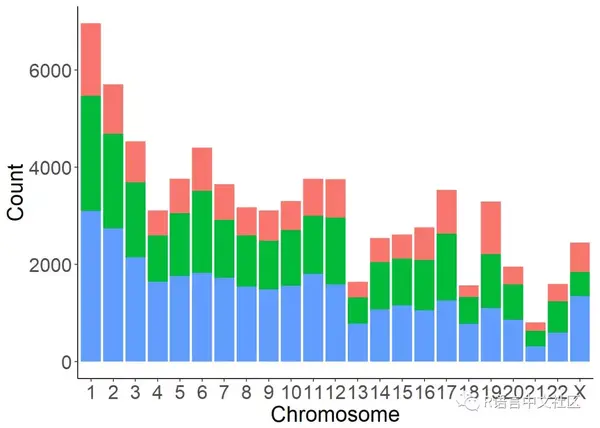
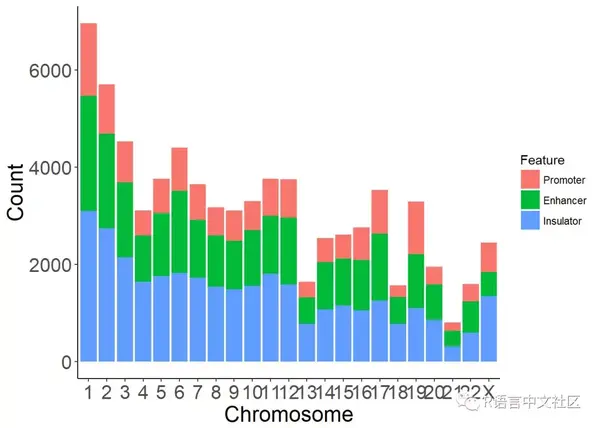
修改坐标轴以及图例标签
ggplot(my_data, aes(x=chrom, fill=type))+

geom_bar()+

labs(x="Chromosome", y="Count", fill="Feature")#这里fill是对应ampping里面的fill映射,显示于图例

主题修改
basic <- ggplot(my_data, aes(x=chrom, fill=type))+

geom_bar()+

labs(x="Chromosome", y="Count", fill="Feature")

#设置文本大小

(basic+theme_gray(base_size = 20))
如果想要使得主题适用于所有的图形,可以通过theme_set()进行设置。
theme_set(theme_gray(base_size = 20))basic
恢复默认设置主题
theme_set(theme_gray())basic
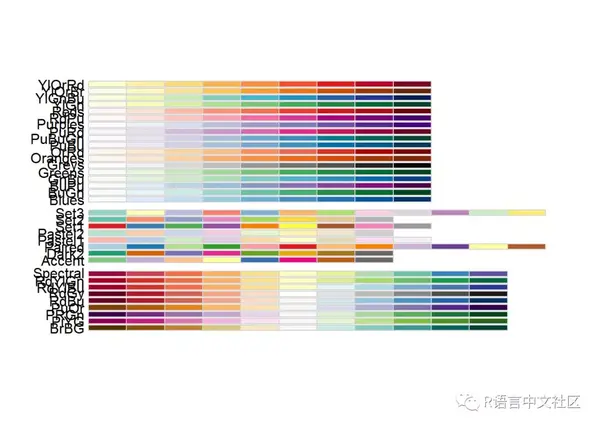
颜色R有个包RColorNBrewer提供调色板
library(RColorBrewer)display.brewer.all()
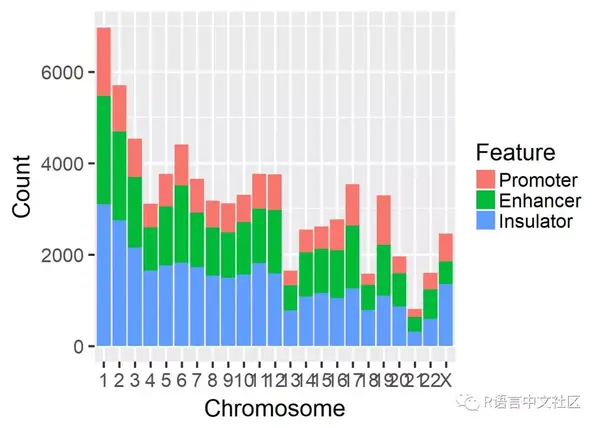
下面测试一下这些调色板
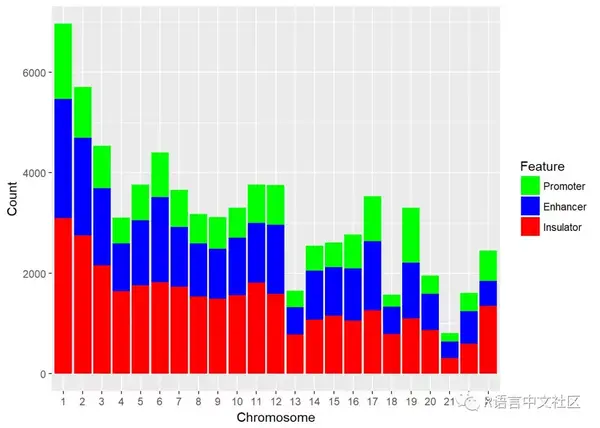
basic+scale_fill_brewer(palette = "Set1")
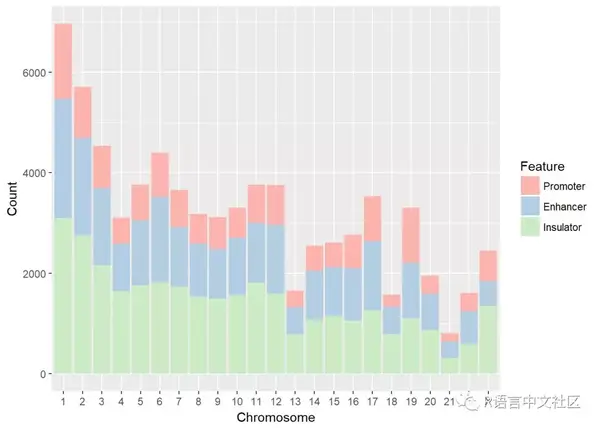
basic+scale_fill_brewer(palette = "Pastel1")
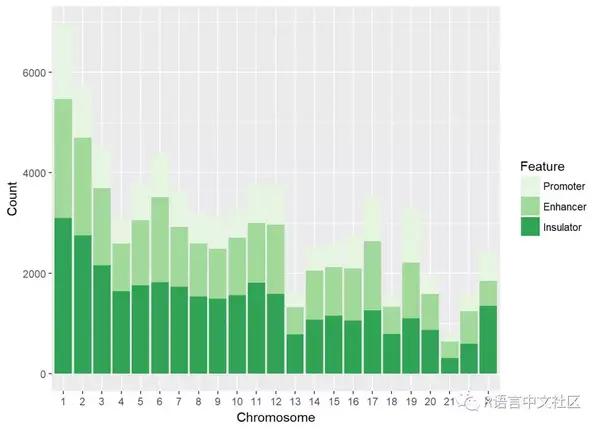
basic+scale_fill_brewer(palette = "YlorRd")
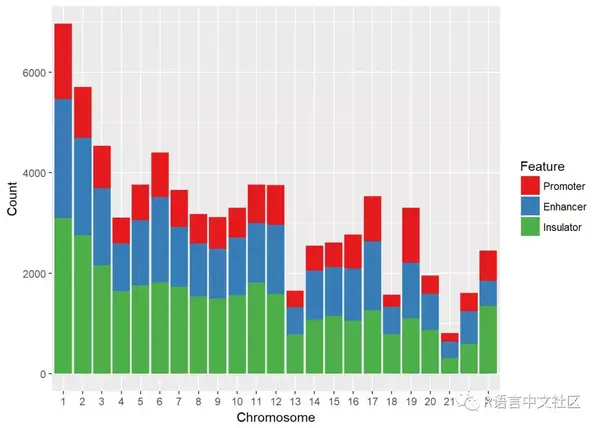
不使用调色板的话也可以自己设置颜色,结合取色器的话很是很赞的
basic+scale_fill_manual(values = c("green", "blue", "red"))
head(colors())


## [1] "white"         "aliceblue"     "antiquewhite"  "antiquewhite1"

## [5] "antiquewhite2" "antiquewhite3"
有的时候我们需要很多种颜色,多到一个调色板都满足不了时怎么办?
chrom_plot <- ggplot(my_data, aes(x=type, fill=chrom))+geom_bar()

chrom_plot

chrom_plot+scale_fill_brewer(type = "qual", palette = 1)
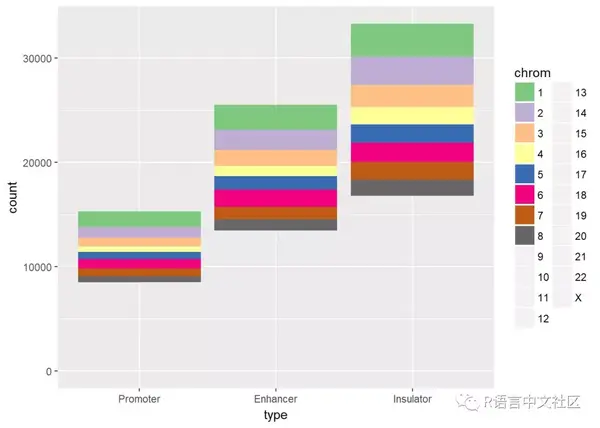
ggplot默认调用的是rainbpw调色板,颜色容易让人误解,不好分辨,但是其他的调色板颜色数量是不足的。这时可以通过将好几个palette合并在一起组成一个新的palette。
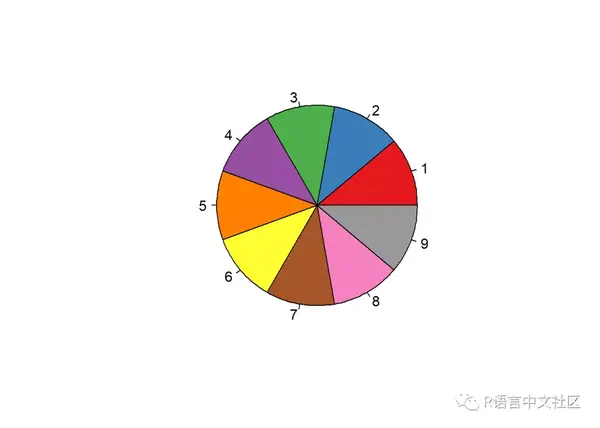
palette1 <- brewer.pal(9, "Set1")
palette1
## [1] "#E41A1C" "#377EB8" "#4DAF4A" "#984EA3" "#FF7F00" "#FFFF33" "#A65628"
## [8] "#F781BF" "#999999"
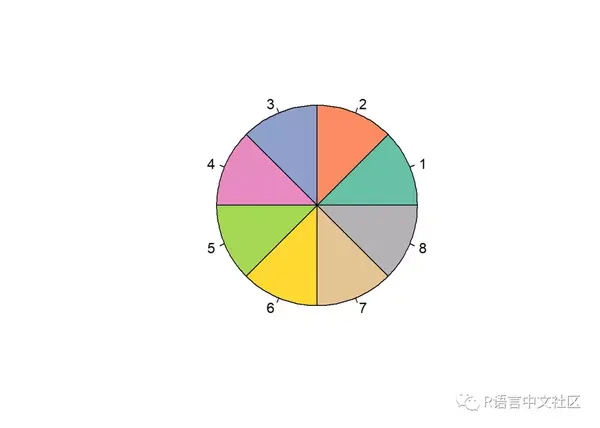
palette2 <- brewer.pal(8, "Set2")
palette2
## [1] "#66C2A5" "#FC8D62" "#8DA0CB" "#E78AC3" "#A6D854" "#FFD92F" "#E5C494"
## [8] "#B3B3B3"
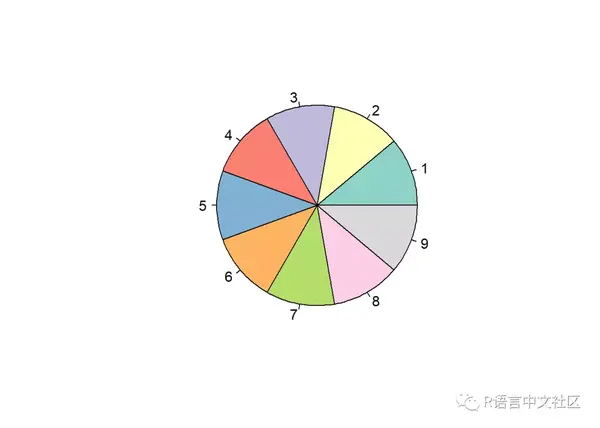
palette3 <- brewer.pal(9, "Set3")
palette3
## [1] "#8DD3C7" "#FFFFB3" "#BEBADA" "#FB8072" "#80B1D3" "#FDB462" "#B3DE69"
## [8] "#FCCDE5" "#D9D9D9"
通过饼图来查看一下这几个调色板
pie(rep(1, length(palette1)), col = palette1)
pie(rep(1, length(palette2)), col = palette2)
pie(rep(1, length(palette3)), col = palette3)
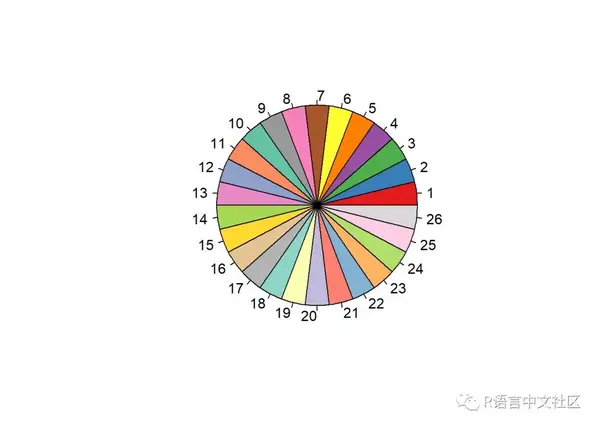
将这几个色斑合并成一个大的调色板
big_palette <- c(palette1, palette2, palette3)pie(rep(1, length(big_palette)), col = big_palette)
chrom_plot+scale_fill_manual(values = big_palette)
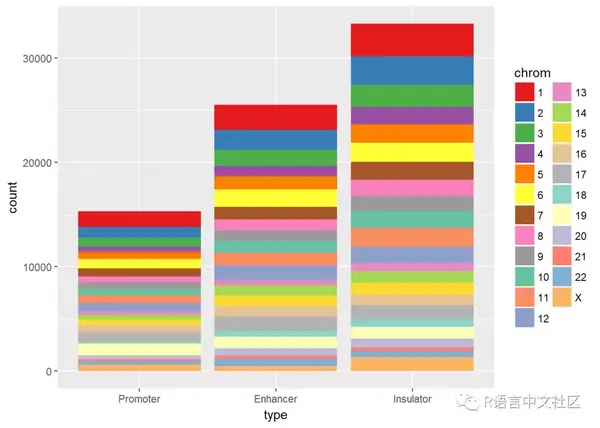
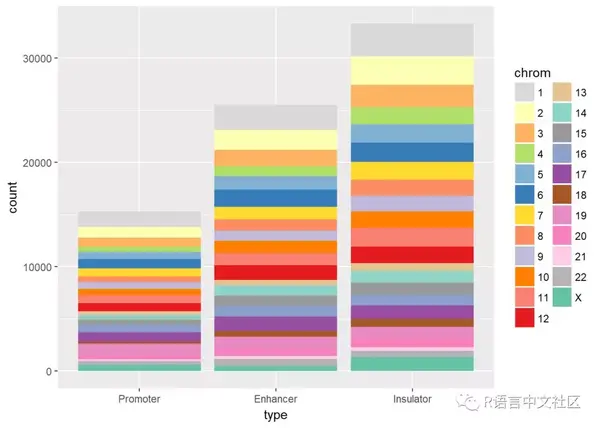
也可以打乱颜色顺序
chrom_plot+scale_fill_manual(values = sample(big_palette))
字体后续大部分调整都是通过theme来实现的。
#对所有字体进行调整basic+theme_gray(base_size = 24, base_family = "Times New Roman")
但是很多时候我们都是对特定字体、标签、颜色等进行特定的调整,这时就可以通过theme逐一调整。
basic+theme(axis.text = element_text(size=20))

basic+theme(axis.title = element_text(size = 20))

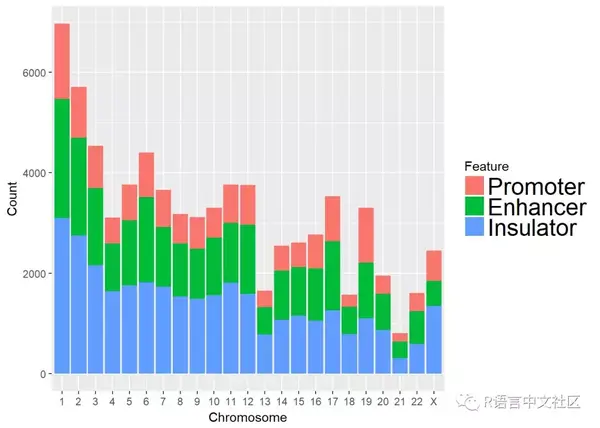
basic+theme(legend.title = element_text(size = 20))
basic+theme(legend.text = element_text(size=20, family = "Times New Roman"))
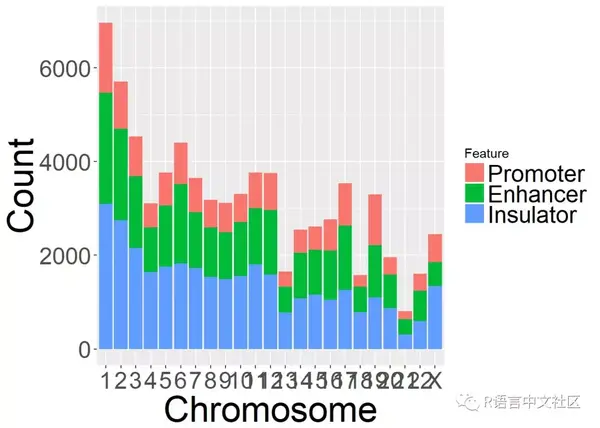
basic+theme(legend.text = element_text(size=20, family = "Times New Roman"),axis.title = element_text(size=30),axis.text = element_text(size=20))
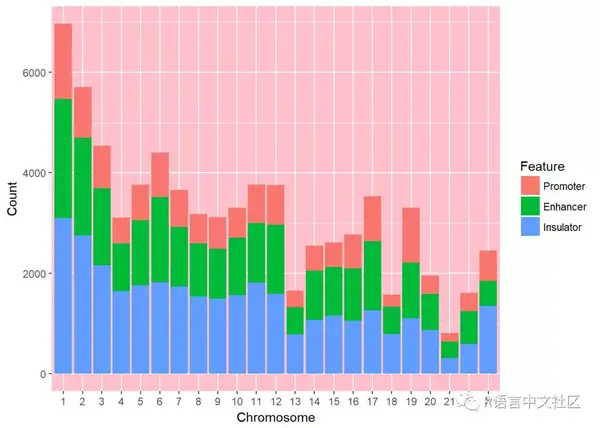
背景
basic+theme(panel.background = element_rect(fill="pink"))
basic+theme(panel.background = element_rect(fill="white"))
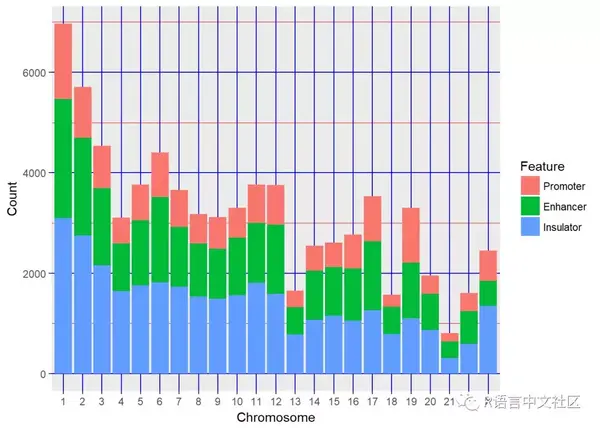
网格线
basic+theme(panel.grid.major = element_line(colour = "blue"), panel.grid.minor = element_line(colour = "red"))
移除所有的网格线
basic+theme(panel.grid.major = element_line(NA),panel.grid.minor = element_line(NA))

只保留y轴线
basic+theme(panel.grid.major.y = element_line(colour = "black", size = 0.20),panel.grid.major.x = element_line(NA),panel.grid.minor = element_line(NA))

修改刻度
basic+theme(axis.ticks = element_line(size=0.2))

basic+theme(axis.ticks = element_line(NA))

basic+theme(axis.ticks = element_line(colour = "blue", size = 2))
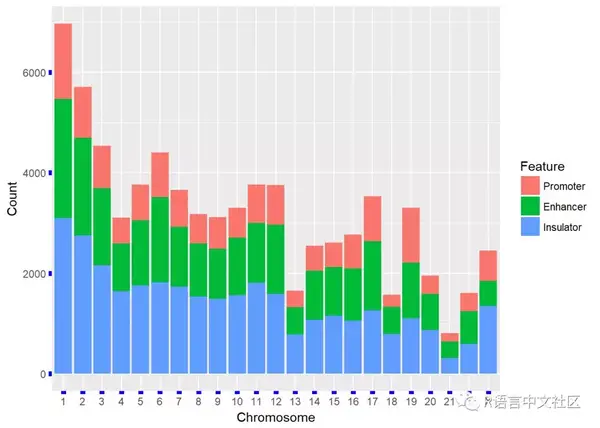
basic+theme(axis.ticks = element_line(size=2),axis.ticks.x = element_line(colour = "blue"),axis.ticks.y = element_line(colour = "red"))

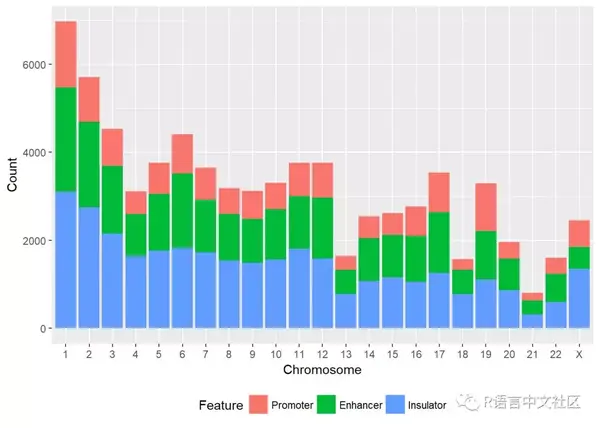
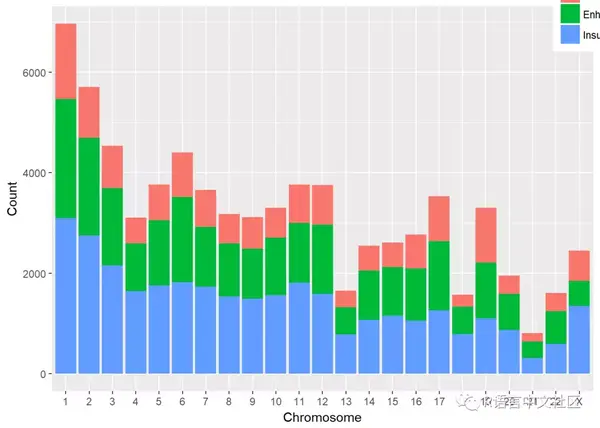
图例修改图例位置
basic+theme(legend.position = "top")

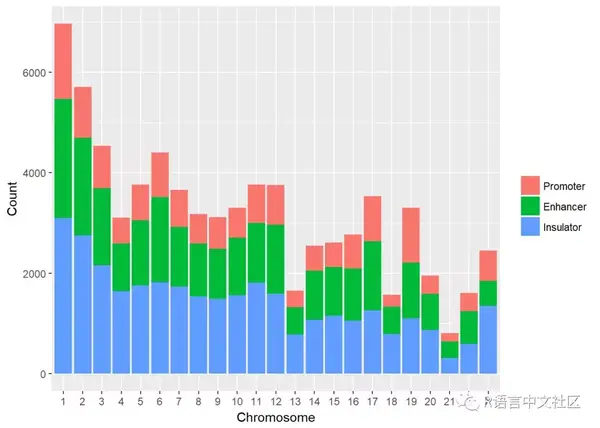
basic+theme(legend.position = "bottom")
basic+theme(legend.position = c(0,0))#左下角
basic+theme(legend.position = c(1,1))#右上角
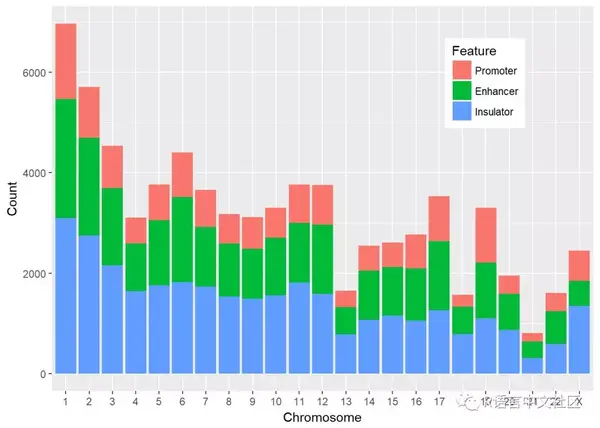
basic+theme(legend.position = c(0.8,0.8))#通过坐标设置可以将图例置于任意位置
移除图例
basic+labs(fill="")
basic+labs(fill="")+theme(legend.position = c(0.8,0.8))
看看文章发表样式图形
publication_style <- basic+guides(fill=FALSE)+


theme(axis.line = element_line(size = 0.5),


panel.background = element_rect(fill=NA, size = rel(20)),


panel.grid.minor = element_line(colour = NA),


axis.text = element_text(size=16),


axis.title = element_text(size = 18))


publication_style
将柱形图与x轴之间的距离消除
publication_style+scale_y_continuous(expand = c(0,0))
可以看到上述图形基本达到了文章发表的水平,因此我们可以将主题theme保存下来以后使用,通过设置全局主题来使所有图形有相同版式。
theme_set(theme_gray()+


theme(axis.line = element_line(size = 0.5),


panel.background = element_rect(fill=NA, size = rel(20)),


panel.grid.minor = element_line(colour = NA),


axis.text = element_text(size = 16),


axis.title = element_text(size = 18)))


basic
basic+scale_y_continuous(expand = c(0,0))+guides(fill=FALSE)
如果需要还原主题设定的话,只要运行以下命令就行:
theme_set(theme_gray())
SessionInfO()
sessionInfo()


## R version 3.4.3 (2017-11-30)

## Platform: x86_64-w64-mingw32/x64 (64-bit)

## Running under: Windows 10 x64 (build 16299)

##

## Matrix products: default

##

## locale:

## [1] LC_COLLATE=Chinese (Simplified)_China.936

## [2] LC_CTYPE=Chinese (Simplified)_China.936

## [3] LC_MONETARY=Chinese (Simplified)_China.936

## [4] LC_NUMERIC=C

## [5] LC_TIME=Chinese (Simplified)_China.936

##

## attached base packages:

## [1] stats     graphics  grDevices utils     datasets  methods   base

##

## other attached packages:

##  [1] RColorBrewer_1.1-2 plyr_1.8.4         forcats_0.2.0

##  [4] stringr_1.2.0      dplyr_0.7.4        purrr_0.2.4

##  [7] readr_1.1.1        tidyr_0.7.2        tibble_1.4.2

## [10] ggplot2_2.2.1.9000 tidyverse_1.2.1

##

## loaded via a namespace (and not attached):

##  [1] Rcpp_0.12.15      cellranger_1.1.0  pillar_1.1.0

##  [4] compiler_3.4.3    bindr_0.1         tools_3.4.3

##  [7] digest_0.6.14     lubridate_1.7.1   jsonlite_1.5

## [10] evaluate_0.10.1   nlme_3.1-131      gtable_0.2.0

## [13] lattice_0.20-35   pkgconfig_2.0.1   rlang_0.1.6

## [16] psych_1.7.8       cli_1.0.0         rstudioapi_0.7

## [19] yaml_2.1.16       parallel_3.4.3    haven_1.1.1

## [22] bindrcpp_0.2      xml2_1.2.0        httr_1.3.1

## [25] knitr_1.18        hms_0.4.1         rprojroot_1.3-2

## [28] grid_3.4.3        glue_1.2.0        R6_2.2.2

## [31] readxl_1.0.0      foreign_0.8-69    rmarkdown_1.8

## [34] modelr_0.1.1      reshape2_1.4.3    magrittr_1.5

## [37] backports_1.1.2   scales_0.5.0.9000 htmltools_0.3.6

## [40] rvest_0.3.2       assertthat_0.2.0  mnormt_1.5-5

## [43] colorspace_1.3-2  labeling_0.3      stringi_1.1.6

## [46] lazyeval_0.2.1    munsell_0.4.3     broom_0.4.3

## [49] crayon_1.3.4
