作者简介Introduction
taoyan:R语言中文社区特约作家,伪码农,R语言爱好者,爱开源。
个人博客: https://ytlogos.github.io/

上次将Lesson 02&03一起讲解完了,在Lesson 04中主要解决下面几个问题
- 剔除掉染色体前缀chr
- 对染色体进行正确排序
- 对数据进行过滤
- 对部分type重命名
加载数据
library(tidyverse)


my_data <- read.csv("Encode_HMM_data.txt", sep = "\t", header = FALSE)

head(my_data[, c(1:6)])

##     V1    V2    V3                V4 V5 V6

## 1 chr1 10000 10600 15_Repetitive/CNV  0  .

## 2 chr1 10600 11137 13_Heterochrom/lo  0  .

## 3 chr1 11137 11737       8_Insulator  0  .

## 4 chr1 11737 11937       11_Weak_Txn  0  .

## 5 chr1 11937 12137   7_Weak_Enhancer  0  .

## 6 chr1 12137 14537       11_Weak_Txn  0  .
对数据部分列进行重命名
names(my_data)[1:4] <- c("chrom", "start", "stop","type")

head(my_data[, c(1:4)])

##   chrom start  stop              type

## 1  chr1 10000 10600 15_Repetitive/CNV

## 2  chr1 10600 11137 13_Heterochrom/lo

## 3  chr1 11137 11737       8_Insulator

## 4  chr1 11737 11937       11_Weak_Txn

## 5  chr1 11937 12137   7_Weak_Enhancer

## 6  chr1 12137 14537       11_Weak_Txn
绘图
ggplot(my_data, aes(x=chrom, fill=type))+geom_bar()
数据调整
主要是针对上面提出的几个问题对数据进行调整
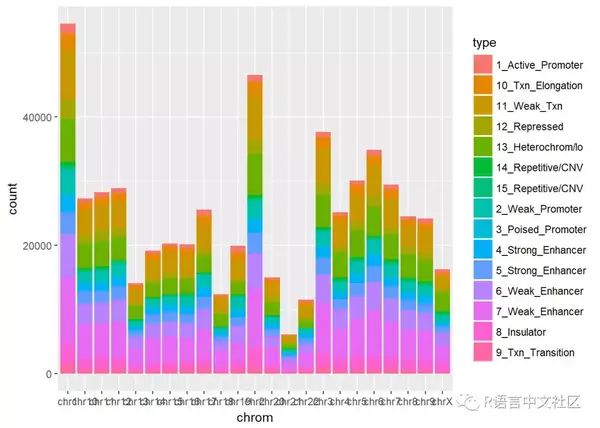
剔除染色体前缀chr
my_data$chrom <- factor(gsub("chr", "", my_data$chrom))ggplot(my_data, aes(x=chrom, fill=type))+geom_bar()

对染色体进行排序
这个关于人类的基因组数据,所以染色体顺序应该是1:22,X,Y。
my_data$chrom <- factor(my_data$chrom, levels = c(seq(1:22), "X", "Y"))ggplot(my_data, aes(x=chrom, fill=type))+geom_bar()
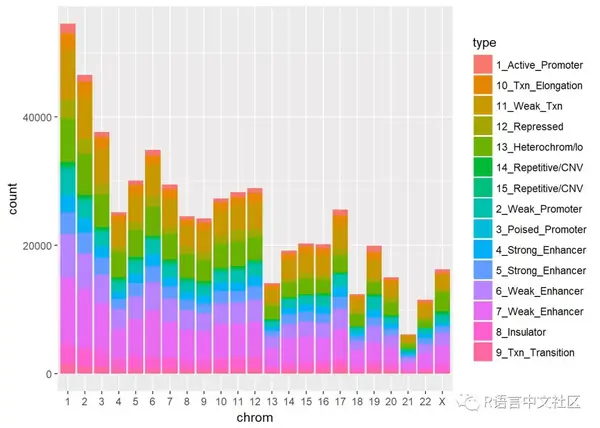
这下看起来相对好一点
选取type
只选取我们感兴趣的type进行可视化
my_data <- my_data[my_data$type %in% c("1_Active_Promoter", "4_Strong_Enhancer", "8_Insulator"), ]
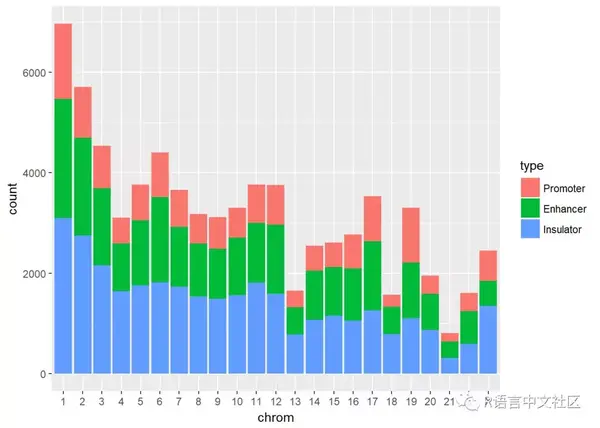
对选取的type进行重命名
library(plyr)
my_data$type <- revalue(my_data$type,c("1_Active_Promoter"="Promoter","4_Strong_Enhancer"="Enhancer","8_Insulator"="Insulator"))
ggplot(my_data, aes(x=chrom, fill=type))+geom_bar()
SessionInfo
SessionInfo

sessionInfo()

## R version 3.4.3 (2017-11-30)

## Platform: x86_64-w64-mingw32/x64 (64-bit)

## Running under: Windows 10 x64 (build 16299)

##

## Matrix products: default

##

## locale:

## [1] LC_COLLATE=Chinese (Simplified)_China.936

## [2] LC_CTYPE=Chinese (Simplified)_China.936

## [3] LC_MONETARY=Chinese (Simplified)_China.936

## [4] LC_NUMERIC=C

## [5] LC_TIME=Chinese (Simplified)_China.936

##

## attached base packages:

## [1] stats     graphics  grDevices utils     datasets  methods   base

##

## other attached packages:

##  [1] plyr_1.8.4         forcats_0.2.0      stringr_1.2.0

##  [4] dplyr_0.7.4        purrr_0.2.4        readr_1.1.1

##  [7] tidyr_0.7.2        tibble_1.4.2       ggplot2_2.2.1.9000

## [10] tidyverse_1.2.1

##

## loaded via a namespace (and not attached):

##  [1] Rcpp_0.12.15      cellranger_1.1.0  pillar_1.1.0

##  [4] compiler_3.4.3    bindr_0.1         tools_3.4.3

##  [7] digest_0.6.14     lubridate_1.7.1   jsonlite_1.5

## [10] evaluate_0.10.1   nlme_3.1-131      gtable_0.2.0

## [13] lattice_0.20-35   pkgconfig_2.0.1   rlang_0.1.6

## [16] psych_1.7.8       cli_1.0.0         rstudioapi_0.7

## [19] yaml_2.1.16       parallel_3.4.3    haven_1.1.1

## [22] bindrcpp_0.2      xml2_1.2.0        httr_1.3.1

## [25] knitr_1.18        hms_0.4.1         rprojroot_1.3-2

## [28] grid_3.4.3        glue_1.2.0        R6_2.2.2

## [31] readxl_1.0.0      foreign_0.8-69    rmarkdown_1.8

## [34] modelr_0.1.1      reshape2_1.4.3    magrittr_1.5

## [37] backports_1.1.2   scales_0.5.0.9000 htmltools_0.3.6

## [40] rvest_0.3.2       assertthat_0.2.0  mnormt_1.5-5

## [43] colorspace_1.3-2  labeling_0.3      stringi_1.1.6

## [46] lazyeval_0.2.1    munsell_0.4.3     broom_0.4.3