taoyan:R语言中文社区特约作家,伪码农,R语言爱好者,爱开源。
个人博客: https://ytlogos.github.io/
公众号:生信大讲堂
简介
这篇博客主要基于d4tagirl(https://d4tagirl.com/2017/05/how-to-plot-animated-maps-with-gganimate),稍微有所修改。
数据加载
library(pacman)
p_load(tidyverse, gganomate, maps, ggthemes)
rladies <- read_csv(url("https://raw.githubusercontent.com/d4tagirl/R-Ladies-growth-maps/master/rladies.csv"))%>%
select(-1)
head(rladies)
## # A tibble: 6 x 7
## screen_name location created_at followers age_days lon lat
## <chr> <chr> <date> <int> <dbl> <dbl> <dbl>
## 1 RLadiesSF San Francis~ 2012-10-15 916 1673 -122 37.8
## 2 RLadiesNYC New York 2016-09-01 309 256 - 74.0 40.7
## 3 RLadiesIstanbul <U+0130>stanbul, T~ 2016-09-06 436 251 29.0 41.0
## 4 RLadiesBCN Barcelona, ~ 2016-10-11 377 216 2.17 41.4
## 5 RLadiesColumbus Columbus, OH 2016-10-04 179 223 - 83.0 40.0
## 6 RLadiesBoston Boston, MA 2016-09-06 259 251 - 71.1 42.4
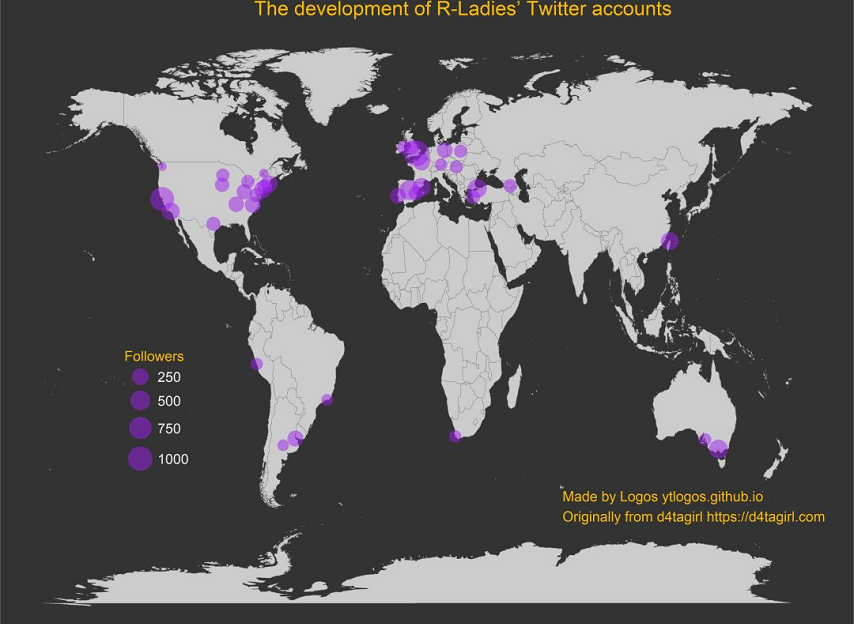
可视化
主要是根据地理位置信息映射到地图上
fig.height=18}
ggplot()+
borders("world", color="gray85", fill="grey80")+
geom_point(data = rladies, aes(lon, lat, size=followers), color="purple", alpha=0.5)+
scale_size_continuous(range = c(8, 24), breaks = c(250, 500, 750, 1000))+
labs(size="Followers", title=" The development of R-Ladies’ Twitter accounts",x=NULL,y=NULL)+
theme(text = element_text(family = "Times New Roman", color = "#EEEEEE"),
plot.title = element_text(size=40,color = "#f9ba00"),
plot.subtitle = element_text(size=14),
axis.ticks = element_blank(),
axis.text = element_blank(),
panel.grid = element_blank(),
panel.background = element_rect(fill="#333333"),
plot.background = element_rect(fill = "#333333"),
legend.position = c(0.18,0.36),
legend.background = element_blank(),
legend.key = element_blank(),
legend.text = element_text(size = 28),
legend.title = element_text(size=28, color = "#f9ba00"))+
annotate(geom = "text",
label="Made by Logos ytlogos.github.io\nOriginally from d4tagirl https://d4tagirl.com",
x=70, y=-55, size=10, family="Helvetica Black", color="#f9ba00", hjust="left")

动画展示
为了利用gganimate进行动态展示,需要构建一个映射变量:时间。同时为了使得可视化开始和结尾呈现的是空白,又构建了两个空白图层
ghost_points_ini <- tibble(created_at=as.Date("2011-09-01"), followers=0, lon=0, lat=0)
ghost_points_fin <- tibble(created_at=seq(as.Date("2017-05-16"), as.Date("2017-05-30"),by="days"), followers=0, lon=0,lat=0)
添加frame映射
map <- ggplot()+
borders("world", color="gray85", fill="grey80")+
geom_point(data = rladies, aes(lon, lat, size=followers, frame=created_at, cumulative=TRUE), color="purple", alpha=0.5)+
scale_size_continuous(range = c(4, 16), breaks = c(250, 500, 750, 1000))+
geom_point(data = ghost_points_ini, aes(lon, lat, size=followers, frame=created_at, cumulative=TRUE), alpha=0)+
geom_point(data = ghost_points_fin, aes(lon, lat, size=followers, frame=created_at, cumulative=TRUE), alpha=0)+
labs(size="Followers", title="The development of R-Ladies’ Twitter accounts",x=NULL,y=NULL)+
theme(text = element_text(family = "Times New Roman", color = "#EEEEEE"),
plot.title = element_text(size=28, color = "#f9ba00"),
plot.subtitle = element_text(size=14),
axis.ticks = element_blank(),
axis.text = element_blank(),
panel.grid = element_blank(),
panel.background = element_rect(fill="#333333"),
plot.background = element_rect(fill = "#333333"),
legend.position = c(0.18,0.36),
legend.background = element_blank(),
legend.key = element_blank(),
legend.text = element_text(size = 18),
legend.title = element_text(size=24, color = "#f9ba00"))+
annotate(geom = "text",
label="Made by Logos ytlogos.github.io\nOriginally from d4tagirl https://d4tagirl.com",
x=70, y=-55, size=6, family="Helvetica Black", color="#f9ba00", hjust="left")
animation::ani.options(interval=0.15, ani.width=1500, ani.height=800, units="in")
gganimate::gganimate(map, filename = "d4tagirlmap.gif")
SessionInfo
sessionInfo()
## R version 3.4.3 (2017-11-30)
## Platform: x86_64-w64-mingw32/x64 (64-bit)
## Running under: Windows 10 x64 (build 16299)
##
## Matrix products: default
##
## locale:
## [1] LC_COLLATE=Chinese (Simplified)_China.936
## [2] LC_CTYPE=Chinese (Simplified)_China.936
## [3] LC_MONETARY=Chinese (Simplified)_China.936
## [4] LC_NUMERIC=C
## [5] LC_TIME=Chinese (Simplified)_China.936
##
## attached base packages:
## [1] stats graphics grDevices utils datasets methods base
##
## other attached packages:
## [1] ggthemes_3.4.0 maps_3.2.0 BiocInstaller_1.28.0
## [4] forcats_0.2.0 stringr_1.2.0 dplyr_0.7.4
## [7] purrr_0.2.4 readr_1.1.1 tidyr_0.8.0
## [10] tibble_1.4.2 ggplot2_2.2.1.9000 tidyverse_1.2.1
## [13] pacman_0.4.6
##
## loaded via a namespace (and not attached):
## [1] reshape2_1.4.3 haven_1.1.1 lattice_0.20-35
## [4] colorspace_1.3-2 htmltools_0.3.6 yaml_2.1.16
## [7] utf8_1.1.3 rlang_0.1.6 pillar_1.1.0
## [10] foreign_0.8-69 glue_1.2.0 modelr_0.1.1
## [13] readxl_1.0.0 bindrcpp_0.2 bindr_0.1
## [16] plyr_1.8.4 munsell_0.4.3 gtable_0.2.0
## [19] cellranger_1.1.0 rvest_0.3.2 psych_1.7.8
## [22] evaluate_0.10.1 labeling_0.3 knitr_1.19
## [25] parallel_3.4.3 broom_0.4.3 Rcpp_0.12.15
## [28] scales_0.5.0.9000 backports_1.1.2 jsonlite_1.5
## [31] mnormt_1.5-5 hms_0.4.1 digest_0.6.15
## [34] stringi_1.1.6 grid_3.4.3 rprojroot_1.3-2
## [37] cli_1.0.0 tools_3.4.3 magrittr_1.5
## [40] lazyeval_0.2.1 crayon_1.3.4 pkgconfig_2.0.1
## [43] xml2_1.2.0 lubridate_1.7.1 assertthat_0.2.0
## [46] rmarkdown_1.8 httr_1.3.1 rstudioapi_0.7
## [49] R6_2.2.2 nlme_3.1-131 compiler_3.4.3
往期精彩内容整理合集
2017年R语言发展报告(国内)
R语言中文社区历史文章整理(作者篇)
R语言中文社区历史文章整理(类型篇)
公众号后台回复关键字即可学习
回复 R R语言快速入门及数据挖掘
回复 Kaggle案例 Kaggle十大案例精讲(连载中)
回复 文本挖掘 手把手教你做文本挖掘
回复 可视化 R语言可视化在商务场景中的应用
回复 大数据 大数据系列免费视频教程
回复 量化投资 张丹教你如何用R语言量化投资
回复 用户画像 京东大数据,揭秘用户画像
回复 数据挖掘 常用数据挖掘算法原理解释与应用
回复 机器学习 人工智能系列之机器学习与实践
回复 爬虫 R语言爬虫实战案例分享