1.在用ggplot画图的过程中,如果我们需要对离散型横坐标的标签进行对应更改的话,可以使用scale_x_discrete函数:
ggplot(data = trip, aes(x = as.factor(usertype))) +

  geom_histogram(colour = "black", fill = "skyblue", stat = "count") +

  scale_x_discrete(breaks = c("Customer", "Subscriber"),

                   labels = c("游客", "居民")) +

  labs(x = "用户类型", y = "出行数量")
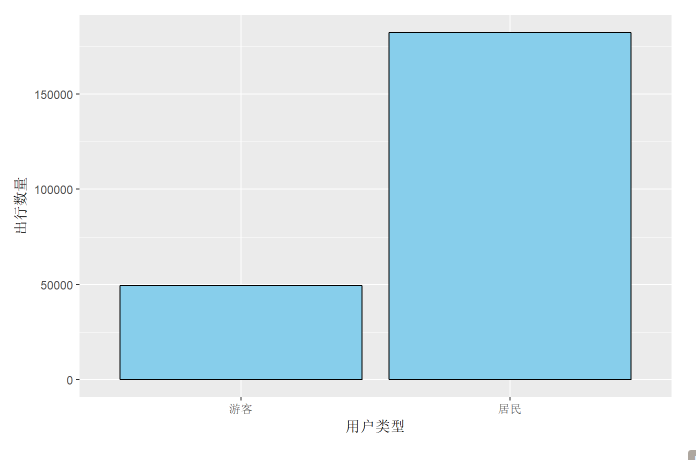
图中,本来横坐标是Customer和Subscriber,经过修改变成了游客,居民。
2.如果对离散型横坐标的标签进行自定义排序的话,同样可以使用scale_x_discrete函数:
trip_stop_w %>%

  filter(usertype == "Subscriber") %>%

  ggplot(aes(x = stoptime_w)) +

  geom_histogram(colour = "black", fill = "skyblue", stat = "count") +

  labs(x = "周几", y = "还车量") +

  scale_x_discrete(limits=c("星期一", "星期二", "星期三", "星期四", "星期五", "星期六", "星期日"))
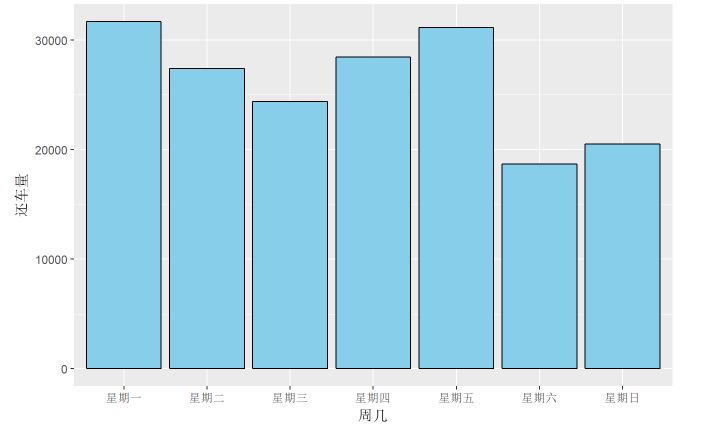
limits中的顺序就是自己想定义的顺序。
