ggplot2新版本2.2.0已经正式发布,其主要特色如下:
1.副标题和字幕
2.分面系统重写
3.优化主题选项
4.优化堆积图
5.bug修复和优化
此次版本更新主要工作由Thomas Pederson完成。ggraph、ggforce和tweenr包都是由他开发。
ggplot2包安装:
install.packages("ggplot2")
一. 副标题和字幕
ggplot(mpg, aes(displ, hwy)) +

  geom_point(aes(color = class)) +

  geom_smooth(se = FALSE, method = "loess") +

  labs(

    title = "Fuel efficiency generally decreases with engine size",

    subtitle = "Two seaters (sports cars) are an exception because of their light weight",

    caption = "Data from fueleconomy.gov"

  )

二. 分面
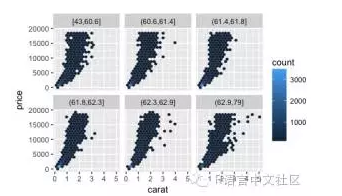
1.分面公式中使用函数
ggplot(diamonds, aes(carat, price)) +

  geom_hex(bins = 20) +

  facet_wrap(~cut_number(depth, 6))
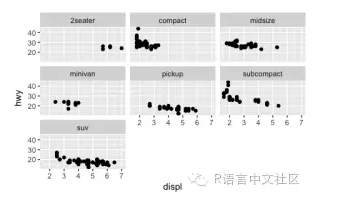
2.使用facet_wrap()函数绘制坐标轴在面板下方
ggplot(mpg, aes(displ, hwy)) +

  geom_point() +

  facet_wrap(~class)
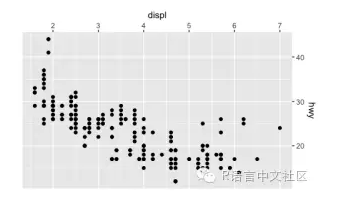
3.使用position参数设置坐标轴位置
ggplot(mpg, aes(displ, hwy)) +

  geom_point() +

  scale_x_continuous(position = "top") +

  scale_y_continuous(position = "right")
4.设置第二个坐标轴,借助 sec.axis
ggplot(mpg, aes(displ, hwy)) +

  geom_point() +

  scale_y_continuous(

    "mpg (US)",

    sec.axis = sec_axis(~ . * 1.20, name = "mpg (UK)")

  )
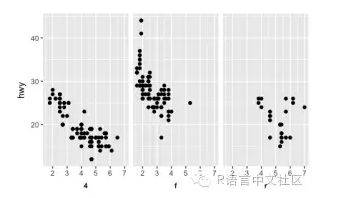
5.图形位置控制,借助strip.placement 参数
ggplot(mpg, aes(displ, hwy)) +

  geom_point() +

  facet_wrap(~ drv, strip.position = "bottom") +

  theme(

    strip.placement = "outside",

    strip.background = element_blank(),

    strip.text = element_text(face = "bold")

  ) +

  xlab(NULL)
三. 主题
1.主题函数theme()经过很大程度优化;
2.element_line()拥有arrow参数,可以在坐标轴设置箭头;
arrow <- arrow(length = unit(0.4, "cm"), type = "closed")


ggplot(mpg, aes(displ, hwy)) +

  geom_point() +

  theme_minimal() +

  theme(

    axis.line = element_line(arrow = arrow)

  )

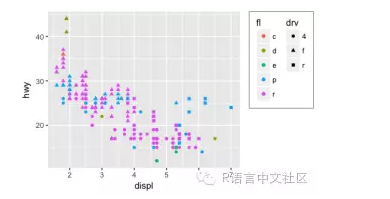
ggplot(mpg, aes(displ, hwy, shape = drv, colour = fl)) +

  geom_point() +

  theme(

    legend.justification = "top",

    legend.box = "horizontal",

    legend.box.margin = margin(3, 3, 3, 3, "mm"),

    legend.margin = margin(),

    legend.box.background = element_rect(colour = "grey50")

  )
四. 堆积图
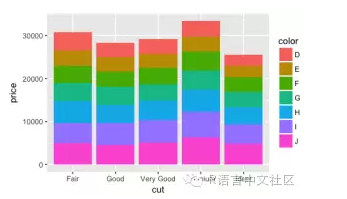
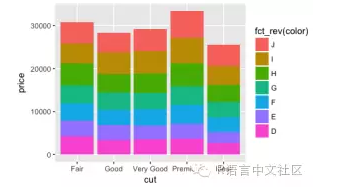
1.position_stack() 和 position_fill()可以控制以相反的次序堆积值。
avg_price <- diamonds %>%

  group_by(cut, color) %>%

  summarise(price = mean(price)) %>%

  ungroup() %>%

  mutate(price_rel = price - mean(price))


ggplot(avg_price) +

  geom_col(aes(x = cut, y = price, fill = color))
ggplot(avg_price) +
 geom_col(aes(x = cut, y = price, fill = fct_rev(color)))
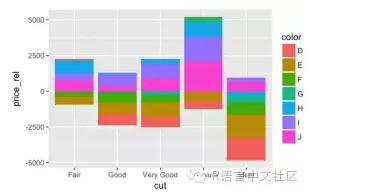
另外,还可以堆积负值。
ggplot(avg_price) +

  geom_col(aes(x = cut, y = price_rel, fill = color))
标签也可以制作堆积图。Labels can also be stacked, but the default position is suboptimal:
series <- data.frame(

  time = c(rep(1, 4),rep(2, 4), rep(3, 4), rep(4, 4)),

  type = rep(c('a', 'b', 'c', 'd'), 4),

  value = rpois(16, 10)

)


ggplot(series, aes(time, value, group = type)) +

  geom_area(aes(fill = type)) +

  geom_text(aes(label = type), position = "stack")