这篇文章教大家如何抓取CBO中国票房网,首先使用XML包抓取电影票房数据,再通过正则表达式对数据进行清洗,最后对数据进行了可视化分析
1.加载所需R
library(XML)

library(ggplot2)

library(ggthemes)

knitr::opts_chunk$set(echo = TRUE)
2.抓取表格
url<-"http://www.cbooo.cn/year?year=2017"

doc<-htmlParse(url,encoding = "UTF-8")

tables<-readHTMLTable(doc)

table<-tables[[1]]
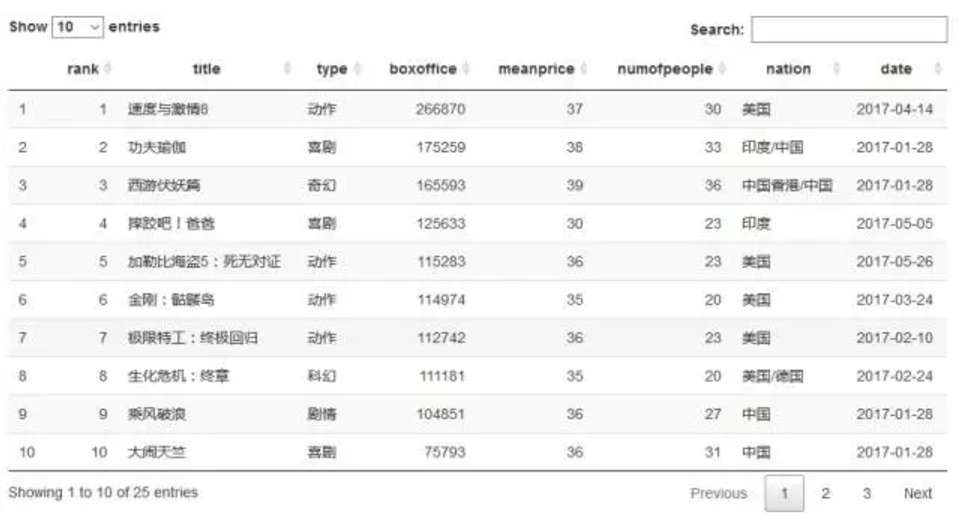
3.数据清洗
names(table) <- c("title", "type", "boxoffice", "meanprice", "numofpeople", "nation", "date")

boxdf <- as.data.frame(lapply(table, as.character), stringsAsFactors=FALSE)

boxdf[,1] <- sub(pattern="\\d{1,2}.", replacement="", table[,1])

boxdf <- cbind(rank = 1:25,boxdf)

col1 <- c(3,7)

col2 <- 4:6

boxdf[, col1] <- lapply(boxdf[,col1], as.factor)

boxdf[, col2] <- lapply(boxdf[,col2], as.numeric)

DT::datatable(boxdf)
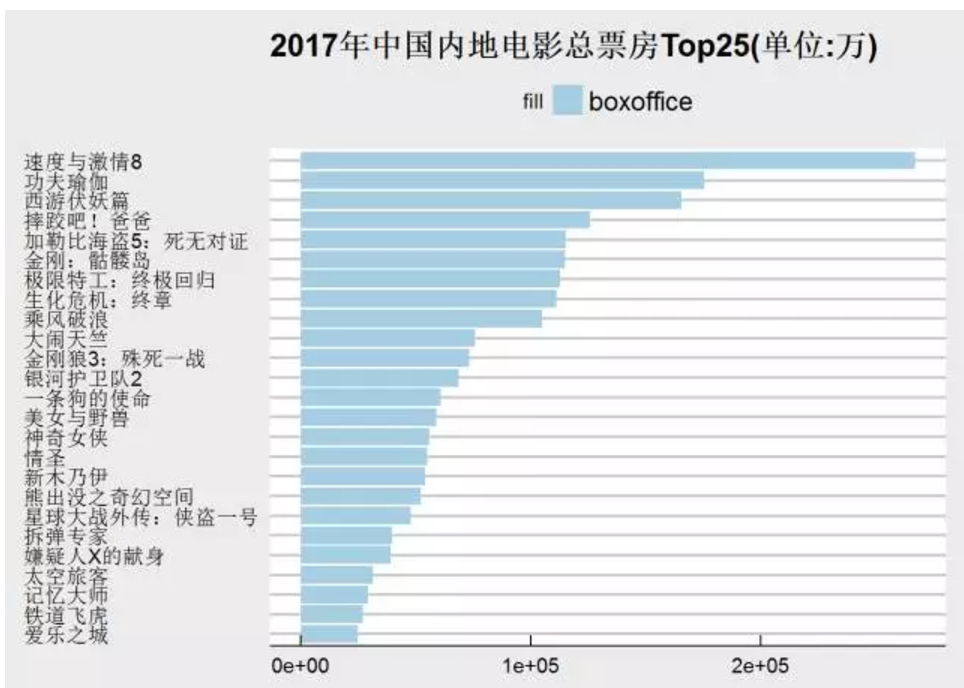
4.可视化结果
ggplot(boxdf)+

geom_bar(aes(x=reorder(title, boxoffice), y=boxoffice, fill = "boxoffice"),

         position = "dodge",stat = "identity")+

   scale_fill_manual(values=c(boxoffice="#A6CEE3")) +

   coord_flip() + labs(x=NULL, y=NULL, title="2017年中国内地电影总票房Top25(单位:万)")+

  theme_economist_white()
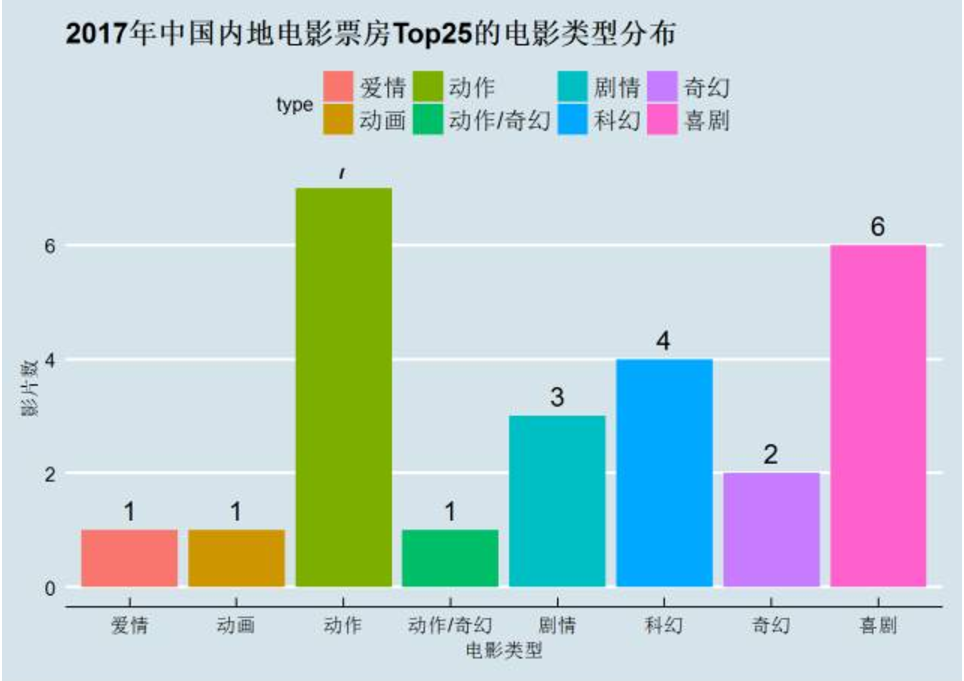
typedata <- as.data.frame(table(boxdf$type))

names(typedata) <- c("type","number")

ggplot(typedata, aes(x=type, y =number, fill=type))+

geom_bar(position="dodge", stat="identity")+

geom_text(aes(label=number), hjust=0.5, vjust=-0.5, size=5) +

labs(x="电影类型",y="影片数", title="2017年中国内地电影票房Top25的电影类型分布")+

  theme_economist()