之前写过两篇关于使用animation包来制作时间维度动态可视化GIF图,效果还是很棒的,最近又发现了一个好玩的包——gganimate,它也是主打制作时间维度动态可视化的,不过该包将动态展示的技术通过一个参数封装到了aes()函数里面,这就意味着我们省去了写繁琐的循环,直接可以通过ggplot函数一步搞定复杂的动态图表制作。
但是方便 至于必然存在缺陷,由于该包给我们的自由调整空间太小,我甚至无法调整输出图表的质量、尺寸,导致最终的成图看起来非常的怪异,无奈每一个案例效果我都用animation包又从新实现了一次,这样大家就可以看到对比效果了。
library(ggplot2)
library(maps)
library(plyr)
library(grid)
library(RColorBrewer)
library("dplyr")
library(gapminder)
library(gganimate)
library(animation)
此次使用的地图是maps中的世界地图,因为原始数据是gapminder包(没错就是那个做动态可视化很吊的团队,他们有个网站就叫gapminder,里面各种高大上动态图,而且还提供了动态图演示的桌面端软件)提供的数据。因为国家名称有出入,我自己又整理了一份对照表。
world_map<-map_data("world")
world_map[world_map$group==1425&world_map$group==1425,"region"]<-"Trinidad and Tobago"
setwd("D:/")
Country<-read.csv("mydata.csv",stringsAsFactors = FALSE,check.names = FALSE)
mapdata<-left_join(gapminder,Country)%>%na.omit()
mapdata$fan<-cut(mapdata$gdpPercap,breaks=c(min(mapdata$gdpPercap),2500,5000,7500,10000,15000,20000,30000,40000,max(mapdata$gdpPercap)),
labels=c("<=2500","2500~5000","5000~7500","7500~10000","10000~1500","1500~20000","20000~30000","30000~40000"," >=40000"),include.lowest=TRUE,order=TRUE)
mapnew_data<-left_join(world_map[,-6],mapdata[,-1],by="region")
使用colorbrewer提供的色盘:
color1<-brewer.pal(9,"YlOrRd")[c(3,4,5,6,7,8,9)]
color2<-brewer.pal(9,"Greens")[c(4,6)]
color<-c(rev(color2),color1)
定制一款主题:
mytheme<-theme(
panel.grid = element_blank(),
panel.background = element_blank(),
axis.text = element_blank(),
axis.ticks = element_blank(),
axis.title = element_blank(),
legend.position ="none",
plot.background=element_rect(I(0),linetype=0)
)
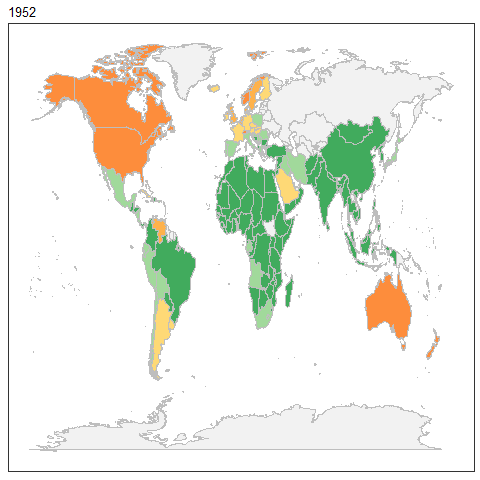
分段填色热力图:(gganimate版)
p1<-ggplot(data=mapnew_data,aes(x=long,y=lat,group=group,fill=fan,frame=year))+
geom_polygon(colour="grey",size=.2)+
guides(fill=guide_legend(reverse=TRUE))+
scale_fill_manual(values=color,na.value="grey95")+
mytheme
gganimate(p1,interval = .5,"output.gif")
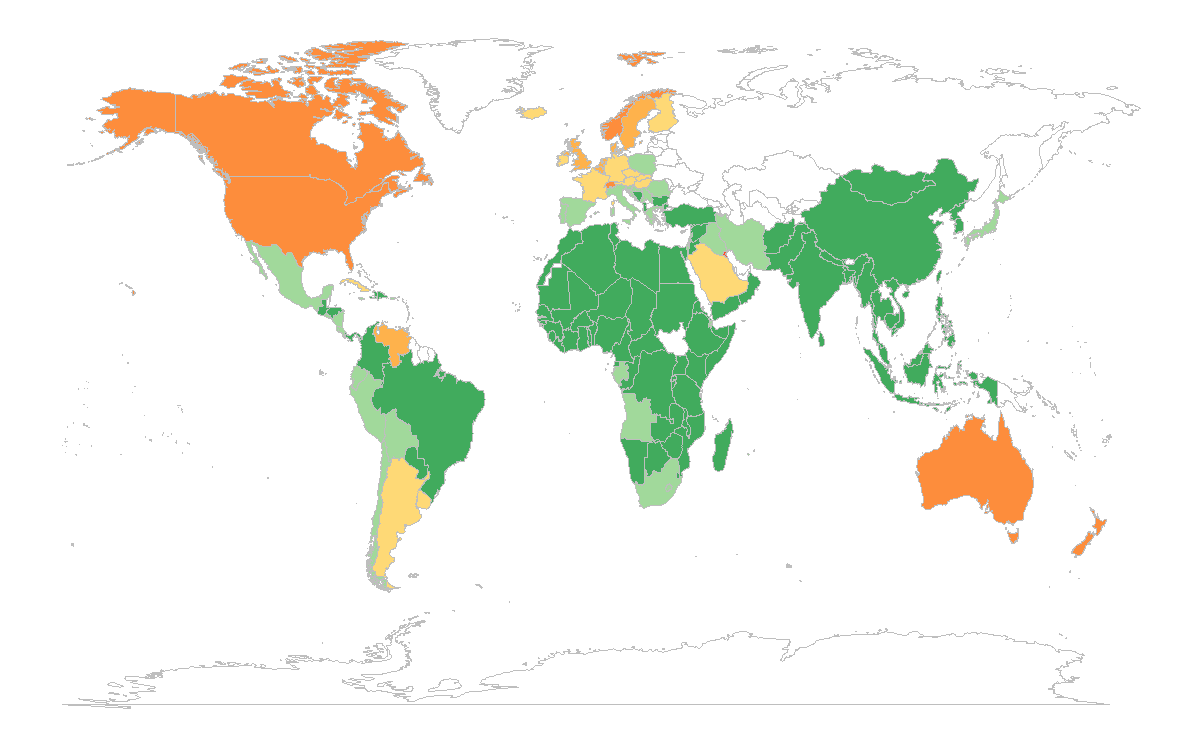
分段填色(animation版)
year<-unique(gapminder$year)
saveGIF({
for (i in year) {
title <- as.character(i)
g1<-ggplot()+
geom_polygon(data=world_map,aes(x=long,y=lat,group=group),fill="white",colour="grey",size=.2)+
geom_polygon(data=filter(mapnew_data,year==i),aes(x=long,y=lat,group=group,fill=fan),colour="grey",size=.2)+
guides(fill=guide_legend(reverse=TRUE))+
scale_fill_manual(values=color,na.value="grey95")+
mytheme
print(g1)
}
},movie.name='world_population_Area.gif',interval=0.2,ani.width=1200,ani.height=750)
制作散点坐标数据:
midpos <- function(AD1){mean(range(AD1,na.rm=TRUE))}
centres <- ddply(mapnew_data,.(region),colwise(midpos,.(long,lat)))
pointdata<-left_join(mapdata[,c(3,5,7)],centres)
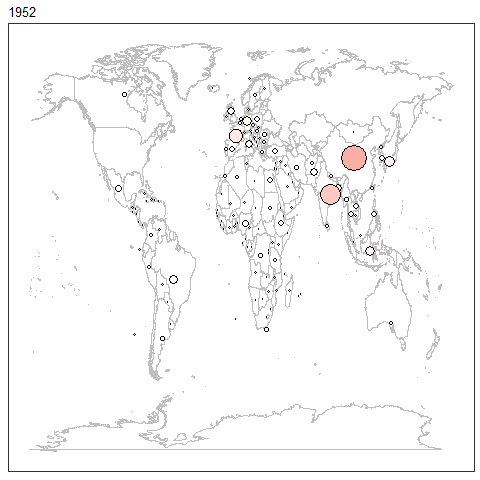
带填色散点图(gganimate版)
p2<-ggplot(data=pointdata,aes(x=long,y=lat,frame=year))+
geom_polygon(data=mapnew_data,aes(x=long,y=lat,group=group),colour="grey",size=.2,fill="white")+
geom_point(aes(size=pop,fill=pop),shape=21,colour="black")+
scale_fill_gradient(low="white",high="#D73434")+
scale_size_area(max_size=18)+
mytheme
gganimate(p2,interval = .5,"output2.gif")
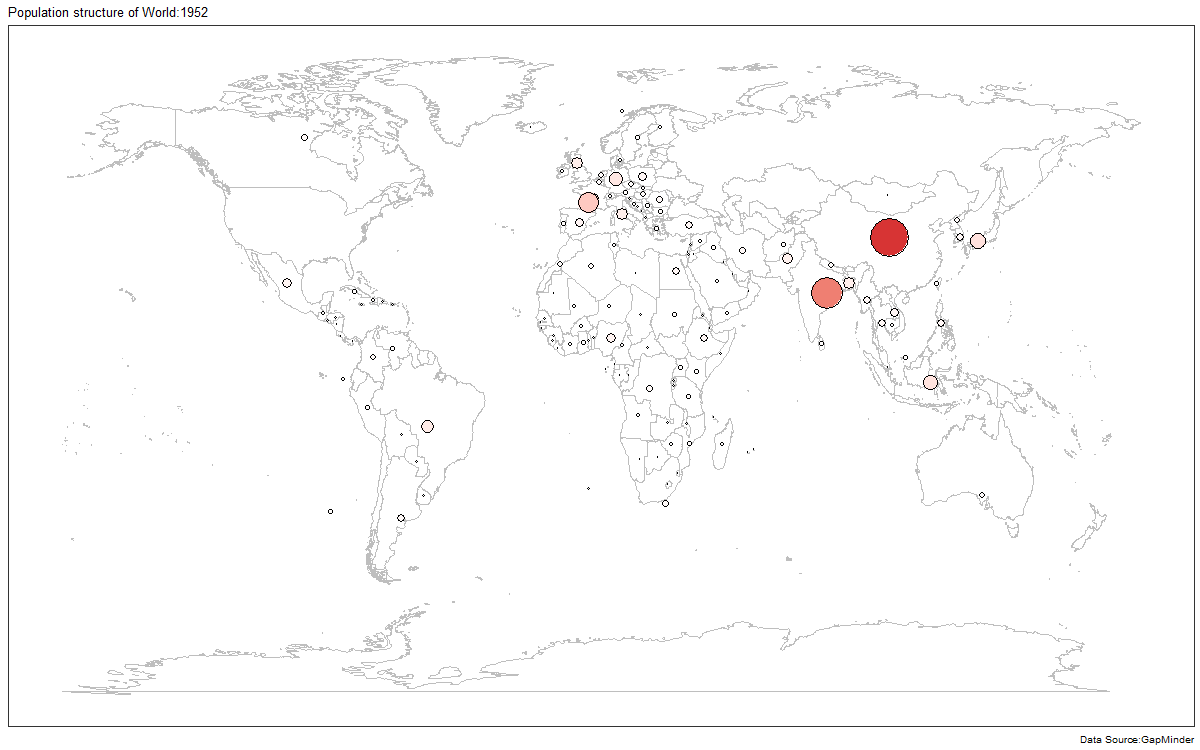
带填色散点图(animation版)
year<-unique(gapminder$year)
saveGIF({
for (i in year) {
title <- as.character(i) g1<-ggplot()+
geom_polygon(data=world_map,aes(x=long,y=lat,group=group),colour="grey",size=.2,fill="white")+
geom_point(data=filter(pointdata,year==i),aes(x=long,y=lat,size=pop,fill=pop),shape=21,colour="black")+
scale_fill_gradient(low="white",high="#D73434")+
labs(title=paste0("Population structure of World:",title),caption="Data Source:GapMinder") +
scale_size_area(max_size=18)+
guides(fill=guide_legend(reverse=TRUE))+
mytheme
print(g1)
}
},movie.name='world_population.gif',interval=0.2,ani.width=1200,ani.height=750)
虽然说gganimate包制作的动态图效果不是很好调整,但是它整合了一些非常棒的功能,大大简化了动态图制作,他也可以制作累计动态图(随着年份增加,在保留过去效果的基础上,增加最新事件内的效果),他不仅可以将时间变量作为切换维度,甚至不限制维度变量性质,即分类资料也是可以支持切换。
案例在ggplot2的扩展包社区里,你也可以在它的GitHub主页上找到相关介绍:
欢迎关注魔方学院QQ群