《釜山行》是一部丧尸灾难片,其人物少、关系简单,非常适合我们学习文本处理。这个项目将介绍共现在关系中的提取,使用R编写代码实现对《釜山行》文本的人物关系进行分析
使用到的R包
library(rvest)

library(jiebaR)

library(stringr)

library(readr)

library(tidyverse)

library(network)

library(sna)

library(ggnetwork)

library(igraph)
抓取《釜山行》剧本
url='http://labfile.oss.aliyuncs.com/courses/677/busan.txt'

text=read_html(url)%>%html_text()

#对剧本进行分段

spltext=str_split(text,'\r\n\r\n \r\n\r\n')

names(spltext) = 'spltextname'

subtext=spltext$spltextname
人物关系挖掘
思路:若两个人物出现在同一段则对其权重加1,每段中对应关系出现多少次加多少次
n=length(spltext$spltextname)

data=vector('list',n)

cutter = worker('mix')

for(i in 1:n) data[[i]] = cutter[subtext[i]][which(cutter[subtext[i]] %in% iden)]

#which(cutter[subtext1] %in% iden)

weidata=data.frame(t(combn(iden,2)))

names(weidata)=c('name1','name2')

weiname=rep(0,136)

for(i in 1:136) weiname[i]=paste(weidata$name1[i],weidata$name2[i],sep = '--')

weidata$weiname=weiname

weidata$weight = rep(0,136)

for(i in 1:72){

    if(length(data[[i]]) != 0){

      test=as.data.frame(table(paste(expand.grid(data[[i]],data[[i]])$Var1,

                              expand.grid(data[[i]],data[[i]])$Var2,sep = '--')))

      test$Var1=as.vector(test$Var1)

      test$Freq=test$Freq/max(test$Freq)

      id1=which(test$Var1 %in% weidata$weiname)

      id2=which( weidata$weiname %in% test$Var1)

      weidata$weight[id2]=weidata$weight[id2]+test$Freq[id1]

    }

}
结果:

weight=0说明两人没有过交际,weight越大关系越密切
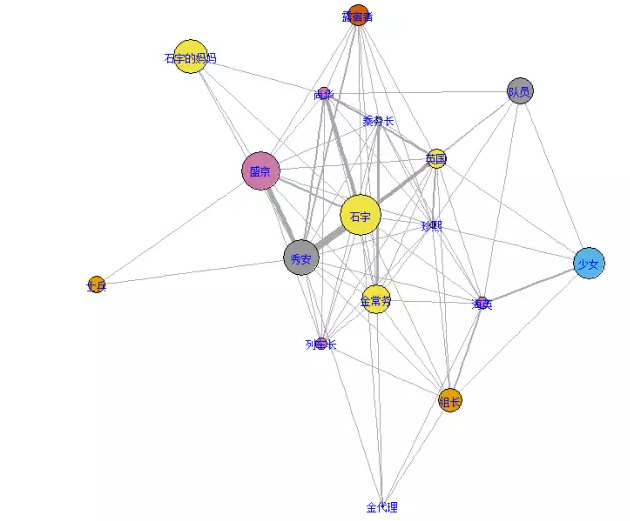
绘制人物关系网络图
taltext=as.data.frame(table(cutter[subtext][which(cutter[subtext] %in% iden)]))

taltext$Var1=as.vector(taltext$Var1)

ind3=rep(0,17)

for(i in 1:17) ind3[i] = taltext$Freq[which(taltext$Var1[i] == iden)]

weidata1 = weidata[which(weidata$weight !=0),]


g1=graph.data.frame(weidata1[,-3], directed = F)

op=par(mar=c(0,0,0,0))

plot(g1, edge.width = E(g1)$weight,

     vertex.size=rank(ind3),

     layout=layout.fruchterman.reingold,

     vertex.color=  ind3,

     vertex.label.cex=0.75,

     vertex.label.color='blue'

     )

par(op)
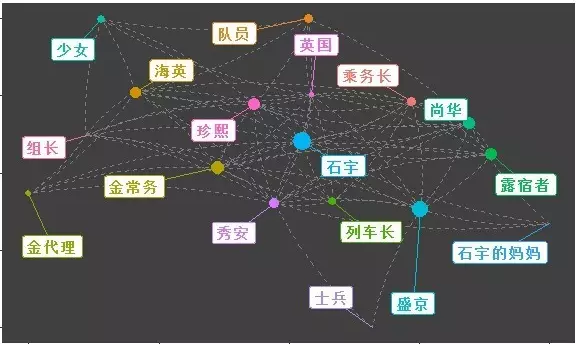
使用ggplot2风格
n=fortify(g1)

ggplot(n, aes(x = x, y = y, xend = xend, yend = yend)) +

  geom_edges(linetype = 2, color = "grey50",curvature = 0.1) +

  geom_nodes(aes(color =  vertex.names, size =  weight)) +

  geom_nodelabel_repel(aes(color = vertex.names, label = vertex.names),

                       fontface = "bold", box.padding = unit(1, "lines")) +

  theme(legend.position='none',

        axis.text = element_blank(),

        axis.title = element_blank(),

  panel.background = element_rect(fill = "grey25"),

  panel.grid = element_blank()

  )
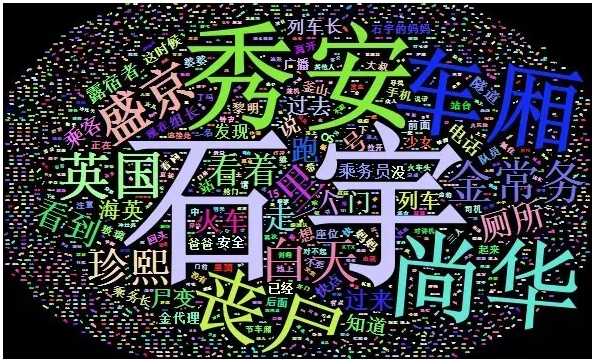
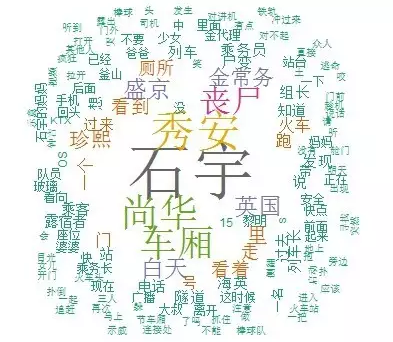
云词图(文本挖掘必备)
require(RColorBrewer)

library(wordcloud)


#这里的停词是把底层的stop_words.utf-8改为txt格式,改之前先备份

wk<-worker('mix',

  stop_word="D:/Program Files/R/R-3.3.2/library/jiebaRD/dict/stop_words.txt")

textda=wk[subtext]

datext=as.data.frame(table(textda))

datext$textda=as.vector(datext$textda)


textdata=arrange(datext,desc(Freq))

textdata1=textdata[which(textdata$Freq>5),]


pal2 <- brewer.pal(8,"Dark2")

wordcloud(textdata1$textda,textdata1$Freq,colors=pal2,random.order=FALSE,ot.per=.45)
library(wordcloud2)

wordcloud2(textdata,color="random-light",backgroundColor = 'black')