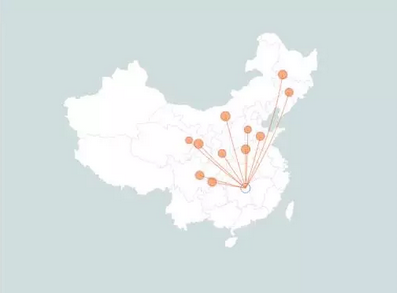
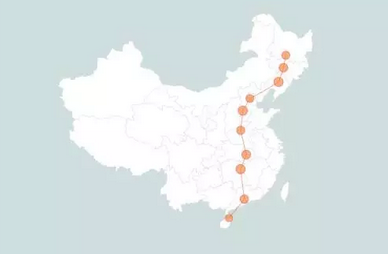
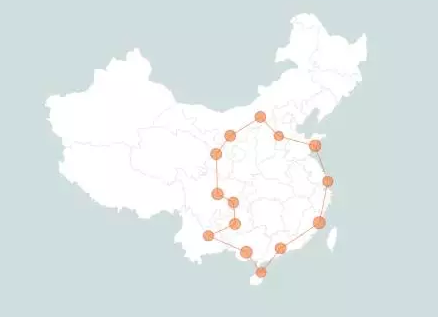
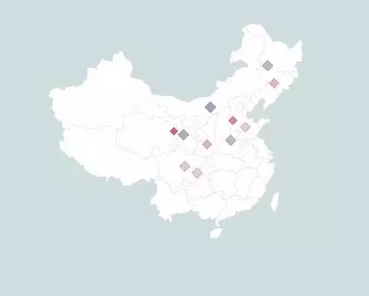
实在没时间写文字步骤了,算了,就甩一篇代码给大家吧,这篇代码包含五张图,分别可以呈现放射状线路图、迁徙路径图、闭环路径图、菱形气泡图、方形气泡图。
library("plyr")
library("dplyr")
library("ggplot2")
library("ggmap")
library("maptools")
library("maps")
library("REmap")
library("Cairo")
library("baidumap")
library(showtext)
################中国地图######################
china_map<-readShapePoly("c:/rstudy/bou2_4p.shp")
x1 <- china_map@data
xs1 <- data.frame(x1,id=seq(0:924)-1)
china_map1 <- fortify(china_map)
china_map_data <- join(china_map1, xs1, type = "full")
mydata1 <- read.csv("c:/rstudy/geshengzhibiao.csv")
china_data <- join(china_map_data, mydata1, type="full")
####################放射路径气泡图#####################
city_list<-c("西安","西宁","郑州","重庆","成都","石家庄","兰州","济南","大同","咸阳","包头")
#address<-get_geo_position(city_list)
address<-getCoordinate(city_list, formatted = T)
address<-data.frame(address,city=row.names(address),stringsAsFactors = FALSE)
del<-getCoordinate("长沙", formatted = T)
del<-as.character(del)
lonx<-as.numeric(rep(del[1],11))
laty<-as.numeric(rep(del[2],11))
address<-data.frame(address,lonx,laty)
address$lonx<-as.numeric(address$lonx)
address$laty<-as.numeric(address$laty)
names(address)[1:2]<-c("lon","lat")
address$Num<-round(runif(11,50,100),2)
#----------------------------------------------------------------------------------------------------
font.add("myfont", "msyhl.ttc")
CairoPNG(file="C:/Users/Administrator/Desktop/航线图1.png",width=1000,height=670)
showtext.begin()
ggplot()+
geom_polygon(data=china_data,aes(x=long,y=lat,group=group),fill="white",size=0.2,colour="#D9D9D9")+
geom_segment(data=address,aes(x=lon,y=lat,xend=lonx,yend=laty),size=0.3,colour="#FF6833")+
geom_point(data=address,aes(x=lon,y=lat,size=Num),shape=21,fill="#ED7D31",col="#E02939",alpha=.6)+
geom_point(data=NULL,aes(x=112.97935,y=28.21347),shape=21,size=8,fill=NA,col="steelblue")+
guides(fill=FALSE)+
coord_map("polyconic")+
scale_size_area(max_size=8)+
theme(
plot.background=element_rect(fill="#D0DEDE", color=NA),
panel.spacing = unit(0,"lines"),
plot.margin=unit(rep(0.2,4),"cm"),
panel.grid = element_blank(),
panel.background = element_blank(),
axis.text = element_blank(),
axis.ticks = element_blank(),
axis.title = element_blank(),
#legend.position=c(0.8,0.3),
legend.position="none"
)
showtext.end()
dev.off()
#######################迁徙路径气泡图#####################
city_list<-c("海口","广州","长沙","武汉","郑州","石家庄","北京","沈阳","长春","哈尔滨")
addA<-getCoordinate(city_list, formatted = T)
addA<-data.frame(addA,city=row.names(addA),stringsAsFactors = FALSE)
data1<-addA[-1,]
names(data1)[1:2]<-c("lonx","latx")
data2<-addA[-length(row.names(addA)),]
names(data2)[1:2]<-c("lony","laty")
addB<-cbind(data2,data1)[,-3]
addA$Num<-round(runif(10,50,100),2)
names(addA)[1:2]<-c("lon","lat")
#-------------------------------------------------------------------------------------------------------
font.add("myfont", "msyhl.ttc")
CairoPNG(file="C:/Users/Administrator/Desktop/航线图2.png",width=1000,height=670)
showtext.begin()
ggplot()+
geom_polygon(data=china_data,aes(x=long,y=lat,group=group),fill="white",size=0.2,colour="#D9D9D9")+
geom_segment(data=addB,aes(x=lonx,y=latx,xend=lony,yend=laty),size=0.3,colour="#FF6833")+
geom_point(data=addA,aes(x=lon,y=lat,size=Num),shape=21,fill="#ED7D31",col="#E02939",alpha=.6)+
guides(fill=FALSE)+
coord_map("polyconic")+
scale_size_area(max_size=8)+
theme(
plot.background=element_rect(fill="#D0DEDE", color=NA),
panel.spacing = unit(0,"lines"),
plot.margin=unit(rep(0.2,4),"cm"),
panel.grid = element_blank(),
panel.background = element_blank(),
axis.text = element_blank(),
axis.ticks = element_blank(),
axis.title = element_blank(),
#legend.position=c(0.8,0.3),
legend.position="none"
)
showtext.end()
dev.off()
########################闭环路径气泡图########################
city_list3<-c("兰州","成都","重庆","贵阳","昆明","南宁","海口","广州","福州","上海","青岛","石家庄","呼和浩特","银川")
addC<-getCoordinate(city_list3, formatted = T)
addC<-data.frame(addC,city=row.names(addC),stringsAsFactors = FALSE)
names(addC)[1:2]<-c("lon","lat")
datac1<-addC[2:14,]
datac2<-addC[1,]
addCC<-rbind(datac1,datac2)
adddata<-cbind(addC,addCC)
names(adddata)<-c("lonx","latx","city","lony","laty","city")
adddata<-adddata[,-3]
addC$Num<-round(runif(14,50,100),2)
#-------------------------------------------------------------------------------------------------------------
CairoPNG(file="C:/Users/Administrator/Desktop/航线图3.png",width=1000,height=670)
showtext.begin()
ggplot()+
geom_polygon(data=china_data,aes(x=long,y=lat,group=group),fill="white",size=0.2,colour="#D9D9D9")+
geom_segment(data=adddata,aes(x=lonx,y=latx,xend=lony,yend=laty),size=0.3,colour="#FF6833")+
geom_point(data=addC,aes(x=lon,y=lat,size=Num),shape=21,fill="#ED7D31",col="#E02939",alpha=.6)+
guides(fill=FALSE)+
coord_map("polyconic")+
scale_size_area(max_size=8)+
theme(
plot.background=element_rect(fill="#D0DEDE", color=NA),
panel.spacing = unit(0,"lines"),
plot.margin=unit(rep(0.2,4),"cm"),
panel.grid = element_blank(),
panel.background = element_blank(),
axis.text = element_blank(),
axis.ticks = element_blank(),
axis.title = element_blank(),
#legend.position=c(0.8,0.3),
legend.position="none"
)
showtext.end()
dev.off()
#-------------------------------------------方形气泡图---------------------------------------------------
CairoPNG(file="C:/Users/Administrator/Desktop/航线图4.png",width=1000,height=670)
showtext.begin()
ggplot()+
geom_polygon(data=china_data,aes(x=long,y=lat,group=group),fill="white",size=0.2,colour="#D9D9D9")+
geom_point(data=address,aes(x=lon,y=lat,size=Num,fill=Num),shape=22,col="#E02939",alpha=.6)+
guides(fill=FALSE)+
scale_fill_gradient2(low="#8E0F2E", mid="#BFBEBE", high="#0E4E75", midpoint=median(na.omit(address$Num)))+
coord_map("polyconic")+
scale_size_area(max_size=8)+
theme(
plot.background=element_rect(fill="#D0DEDE", color=NA),
panel.spacing = unit(0,"lines"),
plot.margin=unit(rep(0.2,4),"cm"),
panel.grid = element_blank(),
panel.background = element_blank(),
axis.text = element_blank(),
axis.ticks = element_blank(),
axis.title = element_blank(),
#legend.position=c(0.8,0.3),
legend.position="none"
)
showtext.end()
dev.off()
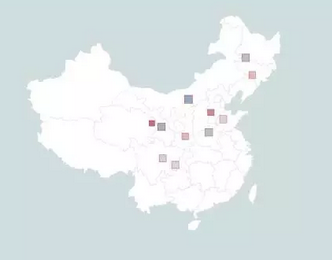
#-----------------------------------------------菱形气泡图-----------------------------------------------------
CairoPNG(file="C:/Users/Administrator/Desktop/航线图5.png",width=1000,height=670)
showtext.begin()
ggplot()+
geom_polygon(data=china_data,aes(x=long,y=lat,group=group),fill="white",size=0.2,colour="#D9D9D9")+
geom_point(data=address,aes(x=lon,y=lat,size=Num,fill=Num),shape=23,col="#E02939",alpha=.6)+
guides(fill=FALSE)+
scale_fill_gradient2(low="#8E0F2E", mid="#BFBEBE", high="#0E4E75", midpoint=median(na.omit(address$Num)))+
coord_map("polyconic")+
scale_size_area(max_size=8)+
theme(
plot.background=element_rect(fill="#D0DEDE", color=NA),
panel.spacing = unit(0,"lines"),
plot.margin=unit(rep(0.2,4),"cm"),
panel.grid = element_blank(),
panel.background = element_blank(),
axis.text = element_blank(),
axis.ticks = element_blank(),
axis.title = element_blank(),
#legend.position=c(0.8,0.3),
legend.position="none"
)
showtext.end()
dev.off()
以上所有图表的指标数据均为随机数虚构,图表的图形代码使用showtext和Cario进行高清渲染并自动输出,除了需加载的地图素材之外,其他代码均可一次性放在控制台流畅运行。