项目要求:
1、从现有数据中,分析出“各个品牌都有多少个商品参与双11活动?”
2、哪些商品真的在打折呢?
3、商家营销套路挖掘?
开始:
一、分析思路:
结构化:

公式化:

二、代码部分
1、导入模块
import numpy as np
import pandas as pd
import matplotlib.pyplot as plt
import warnings
warnings.filterwarnings('ignore')
from bokeh.io import output_notebook
output_notebook()
from bokeh.plotting import figure,show,output_file
from bokeh.models import ColumnDataSource
#数据导入、缺失值处理、类型转换
import os
os.chdir('E:\\项目资料\\项目08电商打折套路解析\\')
df = pd.read_excel('双十一淘宝美妆数据.xlsx',sheet_name = 0)
df.index = df['update_time']
df['date'] = df.index.day
data1 = df[['id','店名','date']]
id_11 = data1['id'][data1['date'] == 11]
data_id_11 = pd.DataFrame(id_11)
data_id_11['sale_on_11'] ='True'
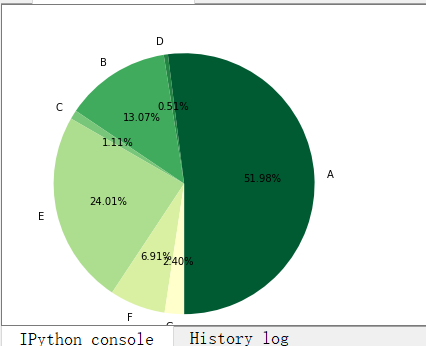
#根据双11,双11前,双11后这三天是否在售来给商品划分
d1 = data1[['id','date']].groupby(by = ['id']).agg(['max','min'])['date']
d1 = pd.merge(d1,data_id_11,left_index = True,right_on = 'id',how='left')
d1.fillna('False',inplace = True)
d1['type'] = '未分类'
d1['type'][(d1['min'] < 11) & (d1['max'] > 11)] = 'A'
d1['type'][(d1['max'] == 11) & (d1['min'] < 11)] = 'B'
d1['type'][(d1['min'] == 11) & (d1['max'] > 11)] = 'C'
d1['type'][(d1['min'] == 11) & (d1['max'] == 11)] = 'D'
d1['type'][(d1['min'] < 11) & (d1['max'] > 11) & (d1['sale_on_11'] == 'False')] = 'F'
d1['type'][d1['max'] < 11] = 'E'
d1['type'][d1['min'] > 11] = 'G'
#统计结果,
result1 = d1['type'].value_counts()
result1 = result1.loc[['A','D','B','C','E','F','G']]
from bokeh.palettes import brewer
colori = brewer['YlGn'][7]
plt.axis('equal')
plt.pie(result1,labels = result1.index.tolist(),colors = colori,radius = 1.5,
autopct = '%.2f%%',startangle= -90)
print('finished!')
#饼图(商品标签)
not_11 = d1[d1['sale_on_11'] =='False']
df_not11 = not_11[['id','type']]
data_not11 = pd.merge(df_not11,df,left_on = 'id',right_on='id',how = 'left')
'''
未参与双十一当天活动的商品,可能有三种情况:
'''
con1 = data_not11[['id','date']][data_not11['type'] == 'F'].groupby(by = ['id']).count().index
data_con2 = data_not11[['id','title','date']].groupby(by = ['id','title']).count()
title_name = data_con2.reset_index()['id'].value_counts()
con2 = title_name[title_name > 1].index
data_con3 = data_not11[data_not11['title'].str.contains('预售')]
con3 = data_con3['id'].value_counts().index
print('con1:%i,con2:%i,con3:%i'%(len(con1),len(con2),len(con3)))
#con1:242,con2:110,con3:453
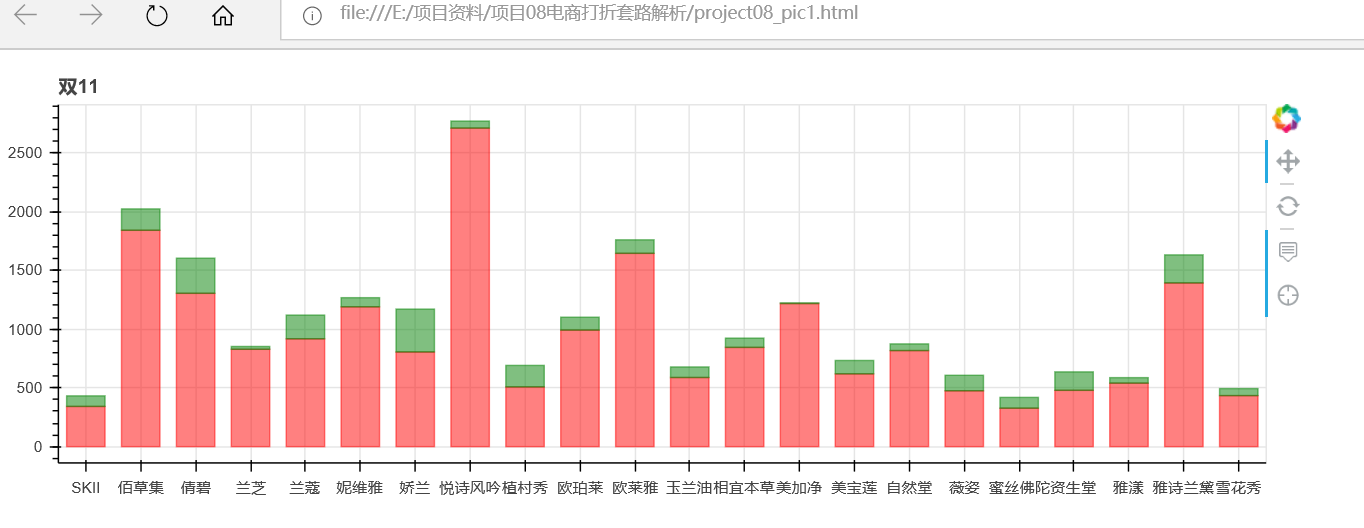
'''
真正参与双十一活动的品牌有哪些?
其各个品牌参与双十一活动的商品数量分布是怎样的?
'''
#id_sale_true = np.hstack((id_11,con3))
#result2 = pd.DataFrame(id_sale_true)
x1= pd.DataFrame({'id':id_11})
x1_df = pd.merge(x1,df,on = 'id', how = 'left')
sale_11_zs = x1_df.groupby('店名')['id'].count()
x2= pd.DataFrame({'id':con3})
x2_df = pd.merge(x2,df,on = 'id', how = 'left')
sale_11_ys = x2_df.groupby('店名')['id'].count()
result2_data = pd.DataFrame({'在售':sale_11_zs,'预售': sale_11_ys})
#画堆叠图
from bokeh.plotting import figure,show,output_file
from bokeh.models import HoverTool
from bokeh.core.properties import value
from bokeh.models import ColumnDataSource
lst_brand = result2_data.index.tolist()
lst_type = result2_data.columns.tolist()[:2]
colors = ['red','green']
result2_data.index.name = 'brand'
result2_data.columns = ['sale_on_11','presell']
source = ColumnDataSource(result2_data)
hover = HoverTool(tooltips = [('品牌','@brand'),
('在售','@sale_on_11'),
('预售','@persell')])
output_file('project08_pic1.html')
p = figure(x_range= lst_brand,plot_width = 900,plot_height = 300,
title = '双11',tools =[hover,'reset,pan,crosshair'] )
p.vbar_stack(lst_type,x = 'brand',source = source,width = 0.7,color = colors,alpha = 0.5
#,legend = [value(x) for x in lst_type],
# muted_color = 'black',muted_alpha = 0.5
)
show(p)
#堆叠图(在售与预售)
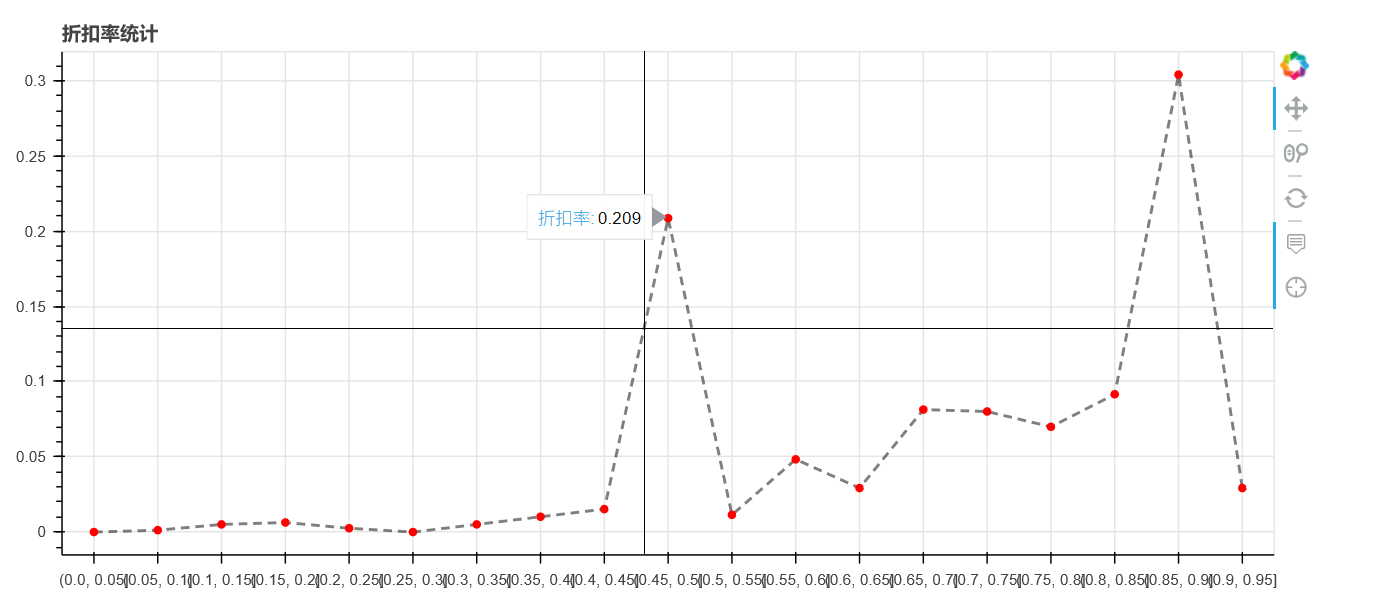
#折扣率的计算
data2 = df[['id','title','店名','date','price']]
data2['period'] = pd.cut(data2['date'],[4,10,11,14],labels = ['双11前','双11当天','双11后'])
#筛选数据
price = data2[['id','price','period']].groupby(['id','price']).min()
price.reset_index(inplace = True)
id_count = price['id'].value_counts()
id_type1 = id_count[id_count == 1].index
id_type2 = id_count[id_count != 1].index
#筛选是否打折
#计算折扣率
result3_data1 = data2[['id','price','店名','period']].groupby(['id','period']).min()
result3_data1.reset_index(inplace = True)
result3_bef = result3_data1[result3_data1['period'] == '双11前']
result3_on11 = result3_data1[result3_data1['period'] == '双11当天']
result3_data2 = pd.merge(result3_bef,result3_on11,on ='id')
#合并数据
result3_data2['zkl'] = result3_data2['price_y'] / result3_data2['price_x']
bokeh_data = result3_data2[['id','zkl']].dropna()
bokeh_data['zkl_range'] = pd.cut(bokeh_data['zkl'],bins = np.linspace(0,1,21))
bokeh_data2 = bokeh_data.groupby(['zkl_range']).count().iloc[:-1]
bokeh_data2['zkl_per'] = bokeh_data2['zkl']/bokeh_data2['zkl'].sum()
#画图
bokeh_data2.index = bokeh_data2.index.astype(np.str)
x_lst = bokeh_data2.index.tolist()
source = ColumnDataSource(bokeh_data2)
hover = HoverTool(tooltips = [('折扣率','@zkl_per')])
output_file('project0803.html')
p = figure(x_range = x_lst,plot_width = 900,plot_height = 400,title ='折扣率统计',
tools = [hover,'reset,wheel_zoom,pan,crosshair'])
p.line(x =bokeh_data2.index.name ,y = 'zkl_per',source = source,line_width = 2,line_alpha = 0.5,line_color = 'black'
,line_dash =[6,4])
p.circle( x = bokeh_data2.index.name,y = 'zkl_per',source = source,color = 'red',size = 5)
show(p)
#折线图
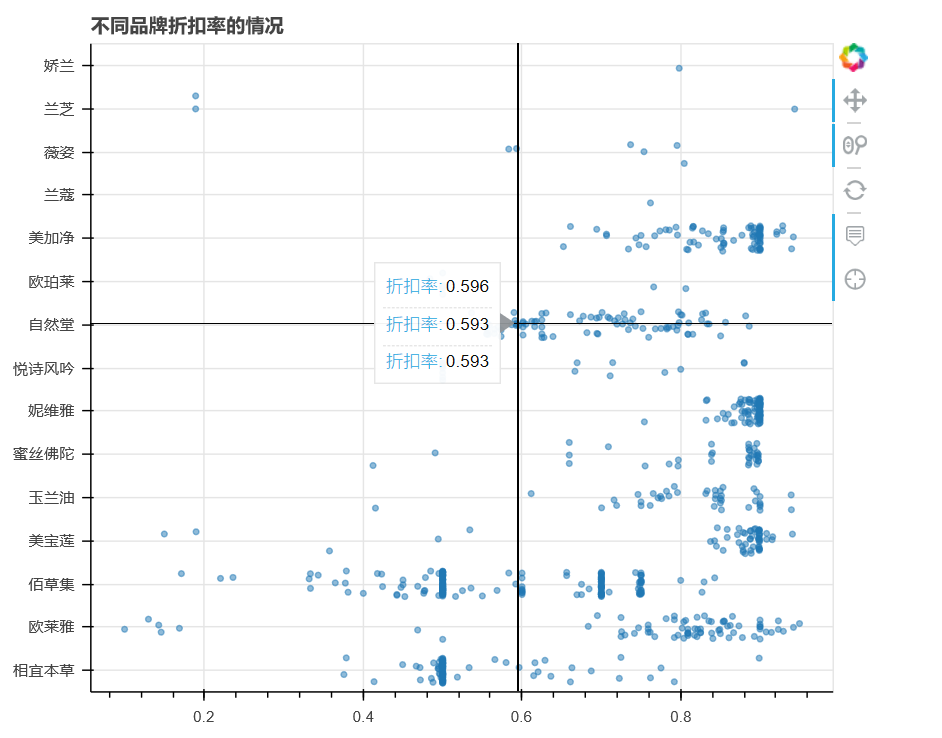
#不同品牌折扣率的分布情况
from bokeh.transform import jitter
bokeh_data3 = result3_data2[['id','店名_x','zkl']].dropna()
bokeh_data3 = bokeh_data3[bokeh_data3['zkl']<0.95]
bokeh_data3.columns = ['id','dm','zkl']
y_pp = bokeh_data3['dm'].dropna().unique().tolist()
source2 = ColumnDataSource(bokeh_data3)
hover = HoverTool(tooltips = [('折扣率','@zkl')])
output_file('project0804.html')
p2 = figure(y_range = y_pp,plot_width = 600,plot_height = 500,
title = '不同品牌折扣率的情况',
tools = [hover,'reset,wheel_zoom,pan,crosshair'])
p2.circle(x = 'zkl',
y = jitter('dm',width = 0.6,range = p2.y_range),
source = source2,alpha = 0.5)
show(p2)
print('finished!')
#营销套路挖掘
data4 = result3_data2[result3_data2['zkl']<0.95]
#计算不同品牌的折扣率
result4_zkl = data4.groupby(['店名_x'])['zkl'].mean()
result4_dz = data4['店名_x'].value_counts()
result4_zs = result3_data2['店名_x'].value_counts()
result4_dzspbl = pd.DataFrame({'打折商品数':result4_dz,'商品总数':result4_zs})
result4_dzspbl['参与打折商品比例'] = result4_dzspbl['打折商品数'] / result4_dzspbl['商品总数']
result4_dzspbl.dropna(inplace = True)
result4_sum = result2_data.copy()
result4_data = pd.merge(pd.DataFrame(result4_zkl),result4_dzspbl,left_index = True, right_index = True, how = 'inner')
result4_data = pd.merge(result4_data,result4_sum,left_index = True, right_index = True, how = 'inner')
# 合并数据
from bokeh.models.annotations import Span # 导入Span模块
from bokeh.models.annotations import Label # 导入Label模块
from bokeh.models.annotations import BoxAnnotation # 导入BoxAnnotation模块
bokeh_data = result4_data[['zkl','商品总数','参与打折商品比例']]
bokeh_data.columns = ['zkl','amount','pre']
bokeh_data['size'] = bokeh_data['amount'] * 0.2
source = ColumnDataSource(bokeh_data)
# 创建ColumnDataSource数据
x_mean = bokeh_data['pre'].mean()
y_mean = bokeh_data['zkl'].mean()
hover = HoverTool(tooltips=[("品牌", "@index"),
("折扣率", "@zkl"),
("商品总数", "@amount"),
("参与打折商品比例", "@pre"),
]) # 设置标签显示内容
p = figure(plot_width=600, plot_height=600,
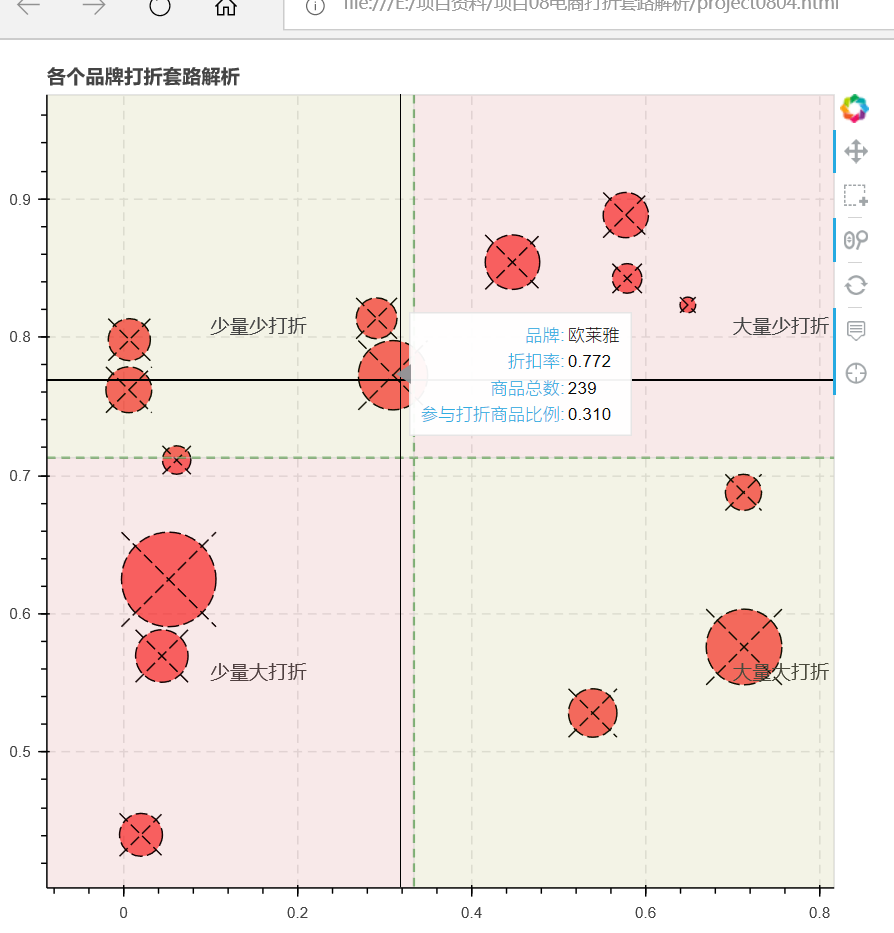
title="各个品牌打折套路解析" ,
tools=[hover,'box_select,reset,wheel_zoom,pan,crosshair'])
# 构建绘图空间
p.circle_x(x = 'pre',y = 'zkl',source = source,size = 'size',
fill_color = 'red',line_color = 'black',fill_alpha = 0.6,line_dash = [8,3])
p.ygrid.grid_line_dash = [6, 4]
p.xgrid.grid_line_dash = [6, 4]
# 散点图
x = Span(location=x_mean, dimension='height', line_color='green',line_alpha = 0.7, line_width=1.5, line_dash = [6,4])
y = Span(location=y_mean, dimension='width', line_color='green',line_alpha = 0.7, line_width=1.5, line_dash = [6,4])
p.add_layout(x)
p.add_layout(y)
# 绘制辅助线
bg1 = BoxAnnotation(bottom=y_mean, right=x_mean,fill_alpha=0.1, fill_color='olive')
label1 = Label(x=0.1, y=0.55,text="少量大打折",text_font_size="10pt" )
p.add_layout(bg1)
p.add_layout(label1)
# 一
bg2 = BoxAnnotation(bottom=y_mean, left=x_mean,fill_alpha=0.1, fill_color='firebrick')
label2 = Label(x=0.7, y=0.55,text="大量大打折",text_font_size="10pt" )
p.add_layout(bg2)
p.add_layout(label2)
# 二
bg3 = BoxAnnotation(top=y_mean, right=x_mean,fill_alpha=0.1, fill_color='firebrick')
label3 = Label(x=0.1, y=0.80,text="少量少打折",text_font_size="10pt" )
p.add_layout(bg3)
p.add_layout(label3)
# 三
bg4 = BoxAnnotation(top=y_mean, left=x_mean,fill_alpha=0.1, fill_color='olive')
label4 = Label(x=0.7, y=0.80,text="少量大打折",text_font_size="10pt" )
p.add_layout(bg4)
p.add_layout(label4)
#四
show(p)
三、总结
双11大多数品牌的商品还是真打折的,其中按照打折的商品的数量和折扣率可以将品牌划分为4类:
少量大打折:兰芝、欧珀莱等品牌
少量少打折:雅诗兰黛、娇兰等品牌
大量少打折:妮维雅、美宝莲等
大量大打折:相宜本草、自然堂等国产大品牌