除了两节练习课之外的笔记。两节练习课还没看。记录了老师上课提到的要点、SQL语句举例以及自己操作时遇到的一些问题。
MySQL安装和启动
安装要输入的
本地设置
端口:3306
用户名:root
密码:123456
Localhost
管理员权限
第一次进入要输入密码
不能连接,有可能是服务未启动
https://jingyan.baidu.com/article/eb9f7b6d7ea3b1869364e889.html
Can't connect to MySQL server on localhost
开始-->控制面板-->管理工具-->服务-->mysql56(也可能是57或更高,版本号)-->启动服务
新建库和表
Schema(库),里面有多个小库。
新建:schema()
name:自定
collation:utf8-utf8_general_ci(win用GB2312或GBK会更好,和win的默认编码环境匹配)
新建表:
在Tables下存放数据,新建一个表。
右单击Tables,create table。
Table Name:命名表
编码Collation依旧是utf8
引擎Enginee默认即可
注释要写清楚,表一旦过多,会很混乱。
建立字段(excel里的列,表头复制到字段名中)
一些打钩项:
http://www.360doc.com/content/15/1107/10/21365845_511374765.shtml
PK:Primary Key 主键
NN:Not Null 不为空
UQ:Unique 唯一性约束
B:Binary
UN:Unsigned
ZF:Zero Fill
AI:Auto Increment 自动递增
G:Generated
Default/Expression:
点击Apply即可
插入行:
点击表右边第三个小图标,打开表。
再点击Import按钮,找到Excel表,导入数据。
work bench 速度慢,容易操作。
如果是乱码,可能csv文件保存的是GBK形式。
那么将excel表存为CSV-UTF8的形式,再次导入即可。
Edit右侧第三个红色小横杠:删除所选行。
数据特别多的情况下,将varchar后的数字增大。
(练习的时候,导入数据一直报错。后来找到报错原因是primary key的字段,即positionID没有去重。去重后就好啦。)
SQL语句使用
MySQL是数据库,SQL是一种数据库语言。
SELECT
SELECT * FROM date.dataanalyst
核心:select(搜索) from(从哪里)
*:通配符,所有
.表名;
执行是个小闪电的按钮,执行单句语句的快捷键为ctrl+Enter
整页语句快捷键为ctrl+Enter+Shift
SELECT city(列名) FROM date.dataanalyst
limit(限制,只搜索……行数据) 100;
通过sql筛选、整理数据后,点export可以生成数据。
排序:order by city(按列名升序排列)或+desc(降序)
筛选过滤:where
where companyID = 4184
where city = "杭州"
where companyID > 1000
where companyID between 1000 and 1500
where companyID in (1331,1337)
where city in("上海")
where city not in("上海")
where city <> !=("上海")
多条件查找:
1、并且 and
select * from data.dataanalyst
where city <> !=("上海")
and education in("本科")
2、或者 or
select * from data.dataanalyst
where city = "上海"
or city = "北京"
3、嵌套
where city = "上海"
and education = "本科"
or workYear = "1-3年"
and 和or都有的时候,and是优先执行的。
where city = "上海"
and (education = "本科"
or workYear = "1-3年")
新手:勤用括号
like:
where secondType like "%开发%"
where secondType like "后端%"
group by 类似于excel里的数据透视表
SELECT * FROM data.dataanalyst
group by city
按城市分组,返回每个城市的第一条数据
在某些设置里,*必须严格等同于字段。例如
SELECT city FROM data.dataanalyst
group by city
添加一个字段,例如职位数量。
SELECT city, count(positionID) FROM data.dataanalyst
group by city
count(positionID)=count(1)=count(*)
区别在于是否包含空值
在count时去重的办法:distinct 字段
SELECT city, count(positionID),count(distinct companyID) FROM data.dataanalyst
group by city
增加更多的分组维度(现在只有城市,增加学历)
SELECT city,education,count(1) FROM data.dataanalyst
group by city, education
having 类似于group by 中的where
也就是在group by的时候,增加了分组的依据。
只想要城市中招聘数量超过一百个的城市。
SELECT * FROM data.dataanalyst
group by city
having count(positionID) >= 100
举个例子
SELECT city, count(1) FROM data.dataanalyst
where industryField like"%电子商务%"
group by city
having count(positionID) >= 50
找出电商岗位超过50个的城市
SELECT city, count(1) FROM data.dataanalyst
group by city
having count(if(industryField like"%电子商务%",1,null)) >= 50
新的需求:
不同城市下,电商占城市岗位总数的占比。
SELECT
city,
count(1),
count(if(industryField like"%电子商务%",industryField,null))
count(if(industryField like"%电子商务%",industryField,null))/count(1)
FROM data.dataanalyst
group by city
having count(if(industryField like"%电子商务%",industryField,null)) >=10
order by count(if(industryField like"%电子商务%",industryField,null))
简化,别名化:
SELECT
city,
count(1) as total,
count(if(industryField like"%电子商务%",industryField,null)) as emarket,
count(if(industryField like"%电子商务%",industryField,null))/count(1)
FROM data.dataanalyst
group by city
having as emarket >=10
order by as emarket
在数据库中拆分数据。
方法一:
select
left(salary,locate('k',salary)-1),
left(right(salary,length(salary)-locate('-',salary))-1),
salary
from data.dataanalyst
方法二:substr(字符串,从哪里开始,截取长度),和excel mid函数一样
select
left(salary,locate('k',salary)-1) as bottom,
substr(salary, locate('-',salary)+1,length(salary)-locate('-',salary)-1) as top,
salary
from data.dataanalyst
子查询
select (bottom+top)/2,salary from(
select
left(salary,locate('k',salary)-1) as bottom,
substr(salary, locate('-',salary)+1,length(salary)-locate('-',salary)-1) as top,
salary
from data.dataanalyst) as t
分组 case when
select
case
when (bottom+top)/2 <=10 then'0~10'
when (bottom+top)/2 <=20 then'10~20'
when (bottom+top)/2 <=30 then'20~30'
else '30+'
end,
salary from(
select
left(salary,locate('k',salary)-1) as bottom,
substr(salary, locate('-',salary)+1,length(salary)-locate('-',salary)-1) as top,
salary
from data.dataanalyst) as t
group by 和 having 想要城市中职位多于100的职位明细
select * from data.dataanalyst
where city in(
select city from data.dataanalyst
group by city
having count(positionID)>=100)
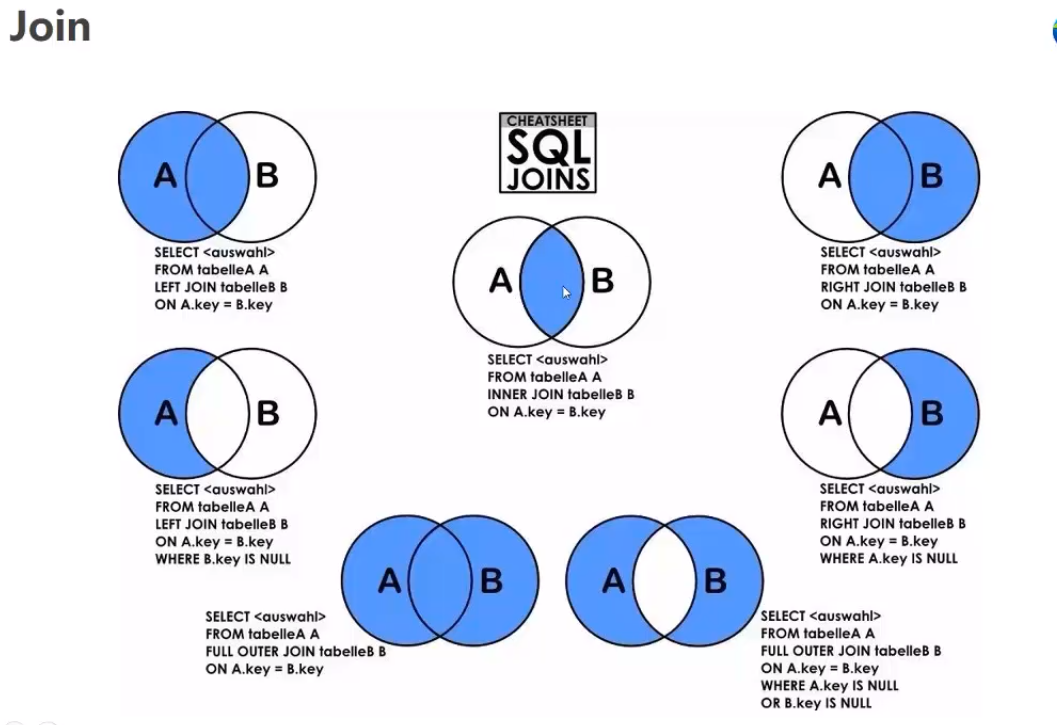
join 围绕多张表分析。
left join 和 join 的区别:
join是取这两张表的交集。left A是全部的,B是部分。
为什么?
有些场景下需要用排除法统计。
left join 举例
select * from analyst.dataanalyst as d
left join
(SELECT * FROM analyst.company
where companySize = '150-500人') as t
on t.companyId = d.companyId;
排除法举例,例如想知道公司在150-500人的职位占所有职位的百分比。
select
count(t.companyId)/count(1)
from analyst.dataanalyst as d
left join
(SELECT * FROM analyst.company
where companySize = '150-500人') as t
on t.companyId = d.companyId;
加载
文件路径为正斜杠而不是拖入的反斜杠
写得比较详细的资料:
https://www.cnblogs.com/bhlsheji/p/5232432.html
load data local infile 'E:/DataAnalyst.csv'
replace into table analyst.dataanalyst
fields terminated by ','
optionally enclosed by '"'
lines terminated by '\n'
ignore 1 lines;
SQL 时间
Time
date(Time) 把时间的日期部分取出
date_format(Time,'%Y-%m') 转换日期格式
date_add(Time, interval - 1 day)
BI连接MySQL
获取数据-更多-MySQL数据库,
服务器:(本地)127.0.0.1(localhost)
数据库:
analyst
(高级设置中还支持SQL语句)
尽量在获取数据的时候就把SQL查询输好。
选择连数据库
输入用户名和密码
选择这些设置所应用的级别
localhosat:analyst
连接、确定。
课后题:
用powerBI做一个数据分析报表。
