电影推荐系统
推荐系统的文献汗牛充栋,大家对此应该都不陌生。之所以选这个题目一是简单,在一周多晚上十点以后的自由时间里,只有选简单的题目才能完成,即便如此,依然捉襟见肘;二是希望好好研究下数据,一步步推到推荐系统的设计,而不是像以前直奔算法,当然也是时间原因,这里对数据的探索也是远远不够的。
本文前面探索阶段所用的数据集太大,导致多个分析运行一天也出不了结果,所以后面在推荐系统的建模中,又换成了较小的 MovieLens 1M 数据集。
import pandas as pd

import numpy as np

import datetime%matplotlib inline
import matplotlib.pyplot as plt数据探索
在数据探索阶段,刚开始是漫无目的的,跟着感觉走,对数据哪一块感兴趣就统计下,排个序,画个图,这样慢慢就对数据熟悉起来,熟悉之后再来考虑如何利用用户历史行为数据来做推荐。
读取数据
读取评分数据:
ratings = pd.read_csv('./ml-latest/ratings.csv', header=0)ratings.head()
ratings['timestamp']=ratings.timestamp.map(datetime.datetime.utcfromtimestamp) # 时间格式转换ratings.head()userIdmovieIdratingtimestamp
011692.52008-03-07 22:08:14
1124713.02008-03-07 22:03:58
21485165.02008-03-07 22:03:55
3225713.52015-07-06 06:50:33
421094874.02015-07-06 06:51:36
ratings.count()userId 22884377
movieId 22884377
rating 22884377
timestamp 22884377
dtype: int64读取电影信息数据:
movies = pd.read_csv('./ml-latest/movies.csv', header=0)movies.head()
movies = movies.set_index("movieId")movies.head()
movies.count()title 34208
genres 34208
dtype: int64该数据集包含了对 34208 部电影的 22884377 个评分数据。
流行度调查
moviefreq = ratings.movieId.value_counts() # 统计每部电影的评分人数,可看出电影的流行程度,默认是降序排列

moviefreq.count()33670sorted_byfreq = movies.loc[moviefreq.index] # 根据频次大小依次取电影信息
sorted_byfreq['ranking']=range(moviefreq.count()) # 加上排名
sorted_byfreq['freq']=moviefreq # 加上频次
sorted_byfreq.iloc[0:10] # 前十大流行电影
sorted_byfreq[sorted_byfreq.title.str.contains('Kill Bill')] # 查看某部电影的流行度
再来看下每部电影的评分次数分布。
moviefreq1 = moviefreq.copy()

moviefreq1.index = range(moviefreq1.count()) # 对索引重新赋值,方便画图

fig, ax = plt.subplots(1, 1, figsize=(12, 4))

moviefreq1.plot(ax=ax, title='Rating times');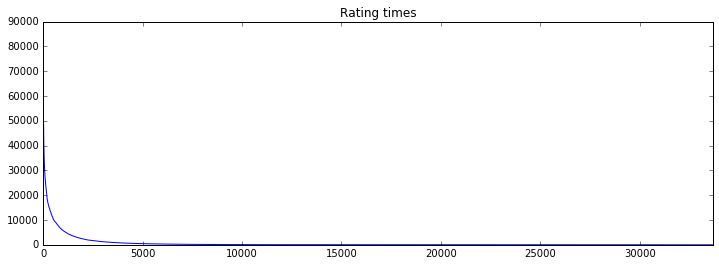
由上可见,对于 34208 部电影来说,评分个数最多的也只有 81296 个,而一共有 247753 个用户,更不用提大量评分次数远小于 10000 的电影,可见,推荐的空间是非常大的。
评分时间区间
统计下评分时间的频次分布。
ts = ratings.timestamp.copy()ts.head()0 2008-03-07 22:08:14
1 2008-03-07 22:03:58
2 2008-03-07 22:03:55
3 2015-07-06 06:50:33
4 2015-07-06 06:51:36
Name: timestamp, dtype: datetime64[ns]ts2 = pd.Series(np.ones(ts.count()).astype('Int32'), index=ts.values).sort_index()ts3 = ts2.to_period("Y").groupby(level=0).count()fig, ax = plt.subplots(1, 1, figsize=(12, 4))
ts3.plot(ax=ax, kind='bar', title='Rating times');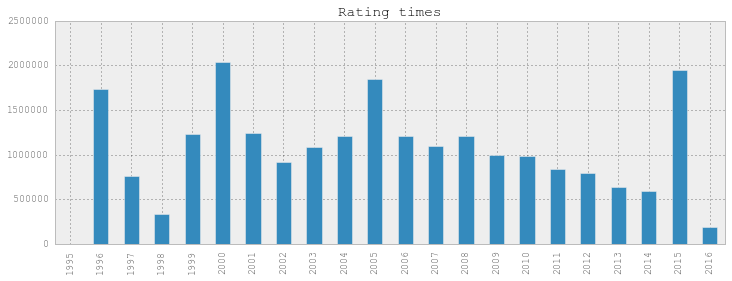
评分次数随年份的分布。
评分排名
怎么根据评分来对电影排名?先试试平均分吧,这个貌似比较公平。
meanrating = ratings['rating'].groupby(ratings['movieId']).mean()meanrating = meanrating.sort_values(ascending = False)meanrating.head()movieId
95517 5.0
148781 5.0
141483 5.0
136872 5.0
139134 5.0
Name: rating, dtype: float64sorted_byrate = movies.loc[meanrating.index] # 根据频次大小依次取电影信息
sorted_byrate['ranking']=range(meanrating.count()) # 加上排名
sorted_byrate['rating']=meanrating # 加上评分
sorted_byrate.iloc[0:10] # 前十大流行电影
上面全 5 分的电影竟然一部都没看过!
sorted_byrate[sorted_byrate.title.str.contains('Kill Bill')] # 查看某部电影的评分
把评分人次也加上。
sorted_byrate = movies.loc[meanrating.index] # 根据频次大小依次取电影信息

sorted_byrate['ranking']=range(meanrating.count()) # 加上排名

sorted_byrate['rating']=meanrating # 加上评分

sorted_byrate['freq']=moviefreq.loc[meanrating.index] # 加上评分个数

sorted_byrate.iloc[0:10] # 前十大流行电影
sorted_byrate[sorted_byrate.title.str.contains('Kill Bill')] # 查看某部电影的评分
原来这些全 5 分的电影都只有 1 个评分!这就把排名排上去了!看来平均分不靠谱,得把评分人次也考虑进去!
先把评分少于 30 个的剔出去。
sorted_byrate2 = sorted_byrate[sorted_byrate.freq>30]sorted_byrate2.head(10) # 前十大评分最高电影

这样看着就正常多了!高分电影有点好电影的样子了。以后没电影看了,就来这排行榜上挨着找,不信你都看过!
评分均值和评分次数的相关性
前十大评分最高电影和前十大评分次数最高的电影中是有重合的,如《Shawshank Redemption》和《Schindler's List》,由此,我们可以验证下评分均值和评分次数的相关性。
fig, ax = plt.subplots(1, 1, figsize=(12, 4))

ax.scatter(sorted_byrate['freq'],sorted_byrate['rating']);
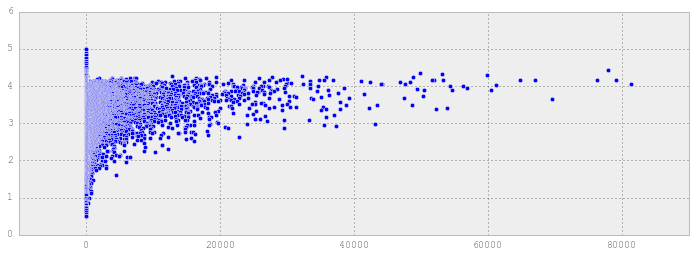
由上图可见,评分少的不见得就平均分就低,从整体趋势来看,评分次数多的,平均分也高。可见,流行电影确实受人欢迎。从另一个角度看,存在不少广受大众欢迎的电影,但也存在不少看的人不多,但评分很高质量很好的电影,太流行的电影肯定大家都看过了,关键是如何找到那些还比较小众的电影,这些电影可能具备大众欢迎的元素,但因宣传做得不好没被大众发现,也可能是这些电影就是小众,在小圈子里非常受欢迎,但到更大的人群中就不行。如何把这些电影推荐给何时的人,是个性化推荐要考虑的问题。
反作弊
找出那些没有真实评分,只给假评分的。
先统计下每个人评分次数的分布。
userfreq = ratings.userId.value_counts() # 统计每个人的评分次数,默认是降序排列

userfreq.count()247753确实是 247753 个人的评分,一个不差,跟 README.txt 说的一样。
userfreq.head()185430 9281
46750 7515
204165 7057
135877 6015
58040 5801
Name: userId, dtype: int64timesfreq = userfreq.copy()
timesfreq.index = range(timesfreq.count()) # 对索引重新赋值,方便画图
timesfreq.head()0 9281
1 7515
2 7057
3 6015
4 5801
Name: userId, dtype: int64fig, ax = plt.subplots(1, 1, figsize=(15, 4))
timesfreq.plot(ax=ax);
ax.set_xlabel("People ID");
ax.set_ylabel("Rating times");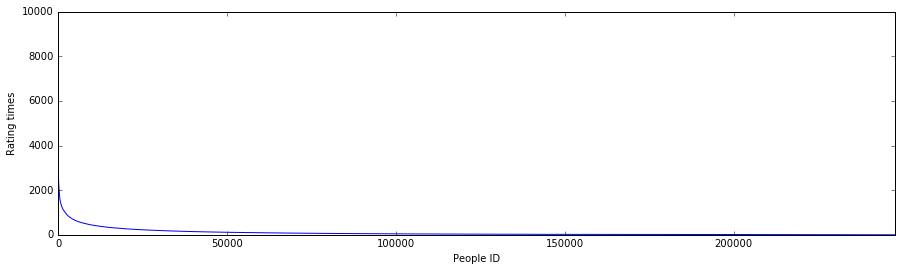
由图可见,人们的评分次数是呈幂律分布的,只有少数人的评分次数巨多,然后迅速过渡到绝大多数人的评分次数。
timesfreq[timesfreq>2000].count()295评分超过 2000 次的人有 295 个,这些人太爱看电影了。至于后面评分较少的,也可能是加入评分较晚,或者看过很多电影,只是没在这评分而已,所以这里面肯定也隐藏了不少电影达人。
下面分别看看评分 2000 次以上和 2000 次以下的评分次数分布。
timesfreq1 = userfreq[userfreq>=2000].copy()

timesfreq1.index = range(timesfreq1.count()) # 对索引重新赋值,方便画图

fig, ax = plt.subplots(1, 1, figsize=(15, 4))

timesfreq1.plot(ax=ax);

ax.set_xlabel("People ID");

ax.set_ylabel("Rating times");
timesfreq2 = userfreq[userfreq<2000].copy()

timesfreq2.index = range(timesfreq2.count())

 # 对索引重新赋值,方便画图fig, ax = plt.subplots(1, 1, figsize=(15, 4))

timesfreq2.plot(ax=ax);

ax.set_xlabel("People ID");ax.set_ylabel("Rating times");
不得不说,幂律分布无处不在啊。
看下评分次数少于 10 次的用户个数。
userfreq[userfreq<10].count()32775竟然有三万多人。
timesfreq3 = userfreq[userfreq<10].copy()

timesfreq3.index = range(timesfreq3.count()) # 对索引重新赋值,方便画图

fig, ax = plt.subplots(1, 1, figsize=(15, 4))

timesfreq3.plot(ax=ax);

ax.set_xlabel("People ID");

ax.set_ylabel("Rating times");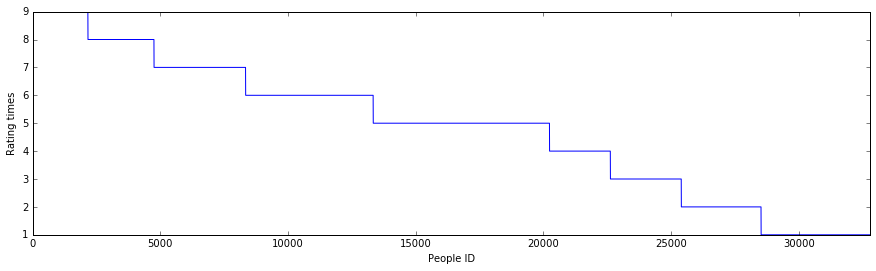
userfreq[userfreq==1].count()4251评分 1 次的就有四千多人。
onerating = ratings[ratings.userId.isin(userfreq[userfreq==1].index.values.tolist())] # 这里的 isin 方法可是费了好大劲找到的

print onerating.count()

print onerating.head()
userId 4251
movieId 4251
rating 4251
timestamp 4251
dtype: int64
userId movieId rating timestamp
10137 108 2302 4.5 1352678182
19688 215 318 3.0 1434516586
23937 263 1029 4.5 1207138536
30266 356 3254 4.0 1325107825
32553 376 7153 5.0 1427304194fig, ax = plt.subplots(1, 1, figsize=(15, 4))
onerating.rating.value_counts().plot(ax=ax, kind='bar', title='Ratings');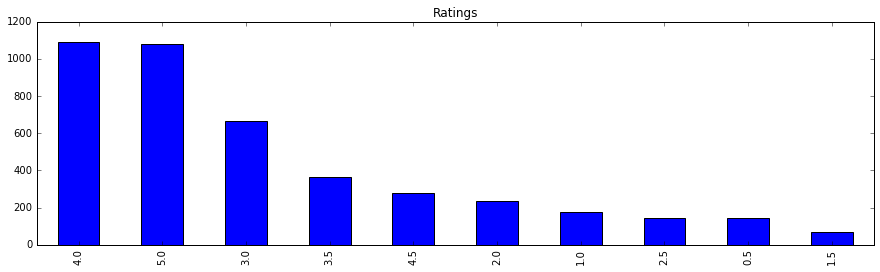
没发现什么异常情况,本来想着只有一次评分的是不是都是来为某电影刷分的,现在否定这种想法。
电影时间的分布
movies.title.head()movieId
1 Toy Story (1995)
2 Jumanji (1995)
3 Grumpier Old Men (1995)
4 Waiting to Exhale (1995)
5 Father of the Bride Part II (1995)
Name: title, dtype: objectmovieyears = movies.title.str.extract('(\((\d{4})\))', expand=True).ix[:,1] # 使用正则表达式取出上映年份
movieyears.head()movieId
1 1995
2 1995
3 1995
4 1995
5 1995
Name: 1, dtype: objectyearfreq = movieyears.value_counts() # 统计每部电影的上映年份,可看出电影的流行程度,默认是降序排列
yearfreq.count()129yearfreqsort = yearfreq.sort_index()
yearfreqsort.head()1874 1
1878 1
1887 1
1888 2
1890 3
Name: 1, dtype: int64看下这些电影的年份分布。
第一幅图太密集了,就分两幅图显示。
fig, ax = plt.subplots(3, 1, figsize=(15, 12))

yearfreqsort.plot(ax=ax[0], kind='bar', title='freq');

yearfreqsort.iloc[0:60].plot(ax=ax[1], kind='bar', title='freq');

yearfreqsort.iloc[60:].plot(ax=ax[2], kind='bar', title='freq');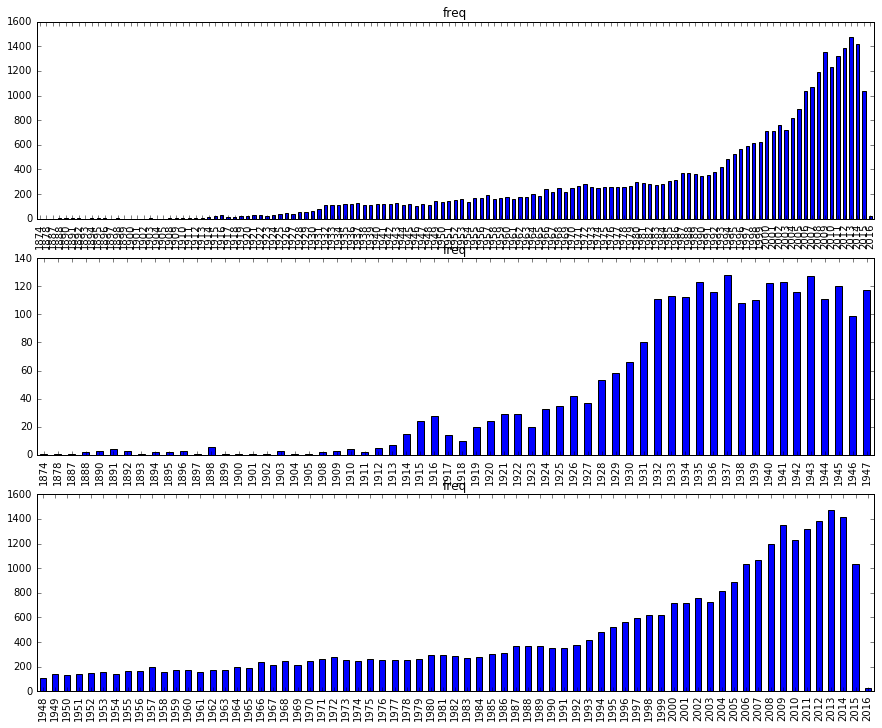
看每年的电影个数,可以感受到历史的变迁。电影个数在上个世纪 90 年代之前一直增长缓慢,到了 90 年代中期开始飞速增长,直到今天。
没想到 1900 年之前还有几部电影。看看什么名字。
movies.ix[movieyears[movieyears<'1900'].index] # 1900 前的电影

都没看过,不过确实挺厉害的,那时我们还是大清朝啊。
下面按年代显示电影个数。
movieyears1 = movieyears.str[:3] + "0s"

yearfreq1 = movieyears1.value_counts() # 统计每部电影的上映年份,可看出电影的流行程度,默认是降序排列

yearfreqsort1 = yearfreq1.sort_index()

fig, ax = plt.subplots(1, 1, figsize=(15, 4))

yearfreqsort1.plot(ax=ax, kind='bar', title='freq');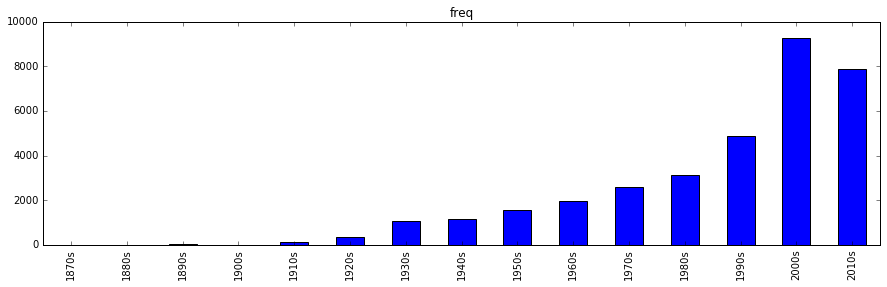
可以看到电影不断增多的趋势,以后也会越来越多。
电影基因的分布
genreslist = [] # 存储为所有电影标注的基因

genreseries = movies.genres.str.split(pat = "|")

genrecount = genreseries.count()

for i in range(genrecount):

    genreslist.extend(genreseries.iloc[i]) # 把 Series 中的所有元素展平组成一个 list

len(genreslist)66668上面的代码运行得比较久,好在数据量不大,看个电视的功夫就完了,但下面再用这个代码就不好使了。
movies.count()title 34208
genres 34208
dtype: int64allmoviegenres = pd.Series(genreslist)
genrestats = allmoviegenres.value_counts()
fig, ax = plt.subplots(1, 1, figsize=(15, 4))
genrestats.plot(ax=ax, kind='bar', title='freq');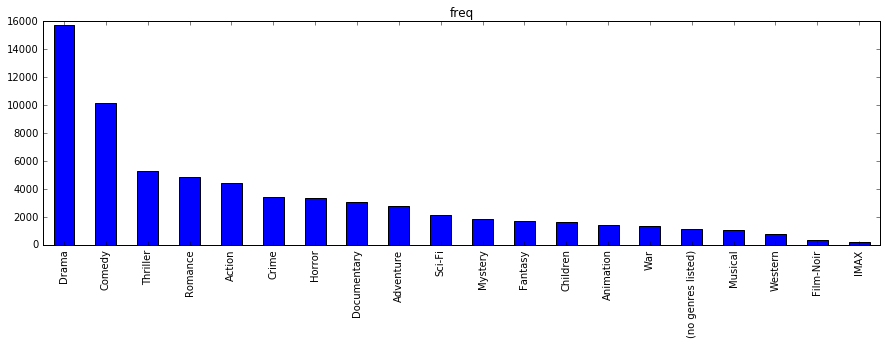
戏剧最多,喜剧其次,接着是惊悚、浪漫、动作、犯罪、恐怖、记录、冒险、科幻、神秘、幻想、儿童、动画、战争、音乐剧、西部、黑色、IMAX。
下面我们看下所有评分的影片的基因分布。
#mi = movies.ix[ratings.movieId]

#genreslist = [] # 存储为所有电影标注的基因

#genreseries = mi.genres.str.split(pat = "|")

#genrecount = genreseries.count()

#for i in range(genrecount):

#    genreslist.extend(genreseries.iloc[i]) # 把 Series 中的所有元素展平组成一个 list

#allmoviegenres = pd.Series(genreslist)

#genrestats = allmoviegenres.value_counts()

#fig, ax = plt.subplots(1, 1, figsize=(15, 4))

#genrestats.plot(ax=ax, kind='bar', title='freq');
上面这段代码运行了一晚上,早上起来一看,内存错误……,为了省事儿,代码写得惨不忍睹……
它实现的功能是取出所有评分涉及电影的基因,并对基因做统计,主要是为了看看观众观看的电影基因的分布,跟上面的电影基因统计还不一样。观众的观看记录代表了用户的兴趣所在,不管最后给的是高分低分,总算是因为感兴趣才看的,所以这里对这些做个统计。
上面的代码没有考虑内存,下面对代码做个优化,对 ratings 里的电影一一提取基因来统计,稍微做改动下就没有内存问题了,但运算速度就没办法了,还是要对 22884377 个评分一个一个提取电影基因。
s1 = pd.Series(np.zeros(20,dtype=np.int32),index=['Drama','Comedy','Thriller','Romance','Action', \

                                                  'Crime','Horror','Documentary','Adventure','Sci-Fi', \

                                                  'Mystery','Fantasy','Children','Animation','War', \

                                                  '(no genres listed)','Musical','Western','Film-Noir','IMAX'])

rcount = ratings.count()[0]

for i in range(rcount):

    if (0 == (i%1000000)): # 相当于进度条,不然 7 个小时暗箱运行也不知道进度

        print i

    mid = ratings.movieId.iloc[i]

    grs = movies.ix[mid].genres.split("|")

    s1.ix[grs] += 1
0
1000000
2000000
3000000
4000000
5000000
6000000
7000000
8000000
9000000
10000000
11000000
12000000
13000000
14000000
15000000
16000000
17000000
18000000
19000000
20000000
21000000
22000000上面这块代码运行了七个多小时!不多说了,赶紧把结果保存下来!
s1.to_csv('genres_distribution.csv')s1Drama 10137200
Comedy 8437502
Thriller 6123348
Romance 4342070
Action 6547286
Crime 3803018
Horror 1685352
Documentary 279609
Adventure 5117321
Sci-Fi 3694890
Mystery 1794175
Fantasy 2449668
Children 1923874
Animation 1362681
War 1206361
(no genres listed) 2454
Musical 974697
Western 472588
Film-Noir 238480
IMAX 676420
dtype: int32s1_sort = s1.sort_values(ascending = False) # 排序fig, ax = plt.subplots(1, 1, figsize=(15, 4))
s1_sort.plot(ax=ax, kind='bar', title='freq');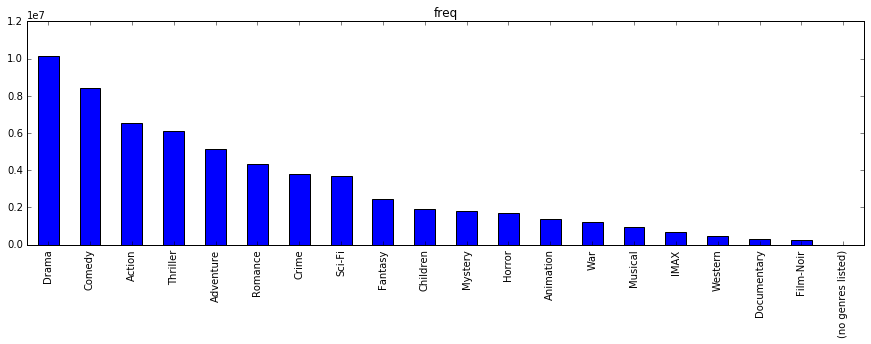
由上可见,观众的评分记录的电影基因跟电影实际存在的基因排序是一致的,可以用电影的拍摄是为了满足观众需求来解释,也可以说是观众有什么看什么。
除了纪录片电影的观看人次相比偏少,有点靠后,供过于求,当然还是建议大家多看记录片,获取知识是一个春风化雨的过程。
推荐系统
由于上面使用大数据集的惨痛教训,这里换成了较小的 MovieLens 1M Dataset 数据集。
读取数据
ratings1m_train = pd.read_csv('./ml-1m/ratings.dat', sep="::", names=['userId','movieId','rating','timestamp'],engine='python')ratings1m_train.head()
ratings1m_train = ratings1m_train.drop(['timestamp','rating'], axis=1) # TopN 推荐忽略具体评分ratings1m_train.count()userId 1000209
movieId 1000209
dtype: int64分离训练集和测试集
from sklearn import cross_validation

from sklearn.cross_validation import train_test_split
ratings1m_train.head()
totalcount = ratings1m_train.count()[0]all_index = np.arange(totalcount)
train_index = np.random.choice(totalcount, int(0.8*totalcount), replace=False) # 从 0 到 totalcount 之间抽 80%,无放回
test_index = np.setdiff1d(all_index, train_index) # 集合的差train_data = ratings1m_train.iloc[train_index]
test_data = ratings1m_train.iloc[test_index]计算用户相似度
users = ratings1m_train.userId.unique()

usersarray([ 1, 2, 3, ..., 6038, 6039, 6040], dtype=int64)movies = ratings1m_train.movieId.unique()
moviesarray([1193, 661, 914, ..., 2845, 3607, 2909], dtype=int64)该数据集包含了 6040 个用户对 3706 部电影的 1000209 个评分。
userSimilarity = pd.DataFrame(0, columns=users, index=users) # 用户相似度矩阵,初始化为 0预测准确度是度量一个推荐系统预测用户行为的能力。这是个非常重要的离线评测指标,计算该指标时要有个离线的数据集,该数据集包含用户的历史行为记录,然后分成训练集和测试集,最后通过在训练集上建立的用户行为模型用于测试集,然后计算预测行为和在测试集的实际行为的重合度作为预测准确度。
一般认为 RMSE 比 MAE 更苛刻,通过平方项加大了对预测不准的评分的惩罚。
准确率是推荐列表中有多大比例是发生了行为的。召回率是用户实际发生的行为有多大比例是来自推荐。
评分预测一直是推荐系统研究的热点,对此,亚马逊前科学家 Greg Linden 认为,电影推荐的目的是找出用户最有可能感兴趣的电影,而不是预测用户看了电影后会给多少分,因此 TopN 更符合应用需求,也许有一部电影用户看了给分很高,但其它用户看的可能性很小,因此预测用户是否会看一部电影,比预测评分更重要。
本次作业是研究 TopN 推荐问题,忽略数据集中的具体评分。TopN 推荐的任务是预测用户会不会对某部电影评分,而不是预测评多少分。
预测推荐
建立物品到用户的倒排表,对于每个物品都保存对该物品产生过行为的用户列表。
movie_users = pd.Series('',index=movies) # 这里 Series 不能直接存空的 list,所以只有先存个空字符串,然后用 split 把它转为 list

movie_users = movie_users.str.split()


for i in train_data.index.values: # 扫描训练数据集

    movie_users.ix[train_data.movieId.ix[i]].append(train_data.userId.ix[i])
import math
C = dict()
N = dict()
for i in movie_users.index.values:
for u in movie_users.ix[i]:
N.setdefault(u,1)
N[u] += 1
for v in movie_users.ix[i]:
if u == v:
continue
C.setdefault(u,{})
C[u].setdefault(v,0)
C[u][v] += 1
for u, related_users in C.items():
for v, cuv in related_users.items():
userSimilarity.ix[u][v]=cuv / math.sqrt(N[u]*N[v])from operator import itemgetter
def recommend(uid, n_sim_user, n_rec_movie):
K = n_sim_user
N = n_rec_movie
rank = dict()
watched_movies = train_data[train_data.userId == uid].movieId.values
simusers = userSimilarity.ix[uid].sort_values(ascending=False)[0:K]
for v in simusers.index.values:
for m in train_data[train_data.userId == v].movieId.values:
if m in watched_movies:
continue
rank.setdefault(m,0)
rank[m] += simusers.ix[v]
# 返回 N 部电影
return sorted(rank.items(), key=itemgetter(1), reverse=True)[0:N]最后计算离线推荐算法的准确率、召回率和覆盖率。
令系统的用户集合为 U, R(u) 是根据用户在训练集上的行为给用户作出的推荐列表,而 T(u) 是用户在测试集上的行为列表。那么推荐结果的准确率定义为:

推荐结果的召回率定义为:

推荐系统的覆盖率为:

代码如下:
def evaluate(n_sim_user, n_rec_movie):

    N = n_rec_movie

    hit = 0

    rec_count = 0

    test_count = 0

    all_rec_movies = set()

    popular_sum = 0

    movie_count = ratings1m_train.movieId.unique().shape[0]


    for uid in train_data.userId.values:

        test_movies = test_data[test_data.userId == uid].movieId

        rec_movies = recommend(uid, n_sim_user, n_rec_movie)

        for movie, w in rec_movies:

            if movie in test_movies.values:

                hit += 1

            all_rec_movies.add(movie)

        rec_count += N

        test_count += test_movies.count()


    precision = hit / (1.0*rec_count)

    recall = hit / (1.0*test_count)

    coverage = len(all_rec_movies) / (1.0*movie_count)


    return (precision, recall, coverage)
print evaluate(20, 10)上面代码运行了一个晚上没有出结果,只得放弃,计算量太大。