上一篇文章是一篇关于使用TensorFlow和R语言的一个图像识别,今天就用shiny将它包装成一个小程序。
shiny程序分为两个部分,一个是ui.R,一个是server.R。ui.R实现的是前端,server.R实现的是服务器端。
我的ui.R是在Windows系统上面写的,准备在写server.R的时候再在Linux上面写,因为总感觉在Windows下方便许多。为了使界面更加美观,我在ui.R里面也加了一点点的CSS,效果如下,感觉界面也差不多。
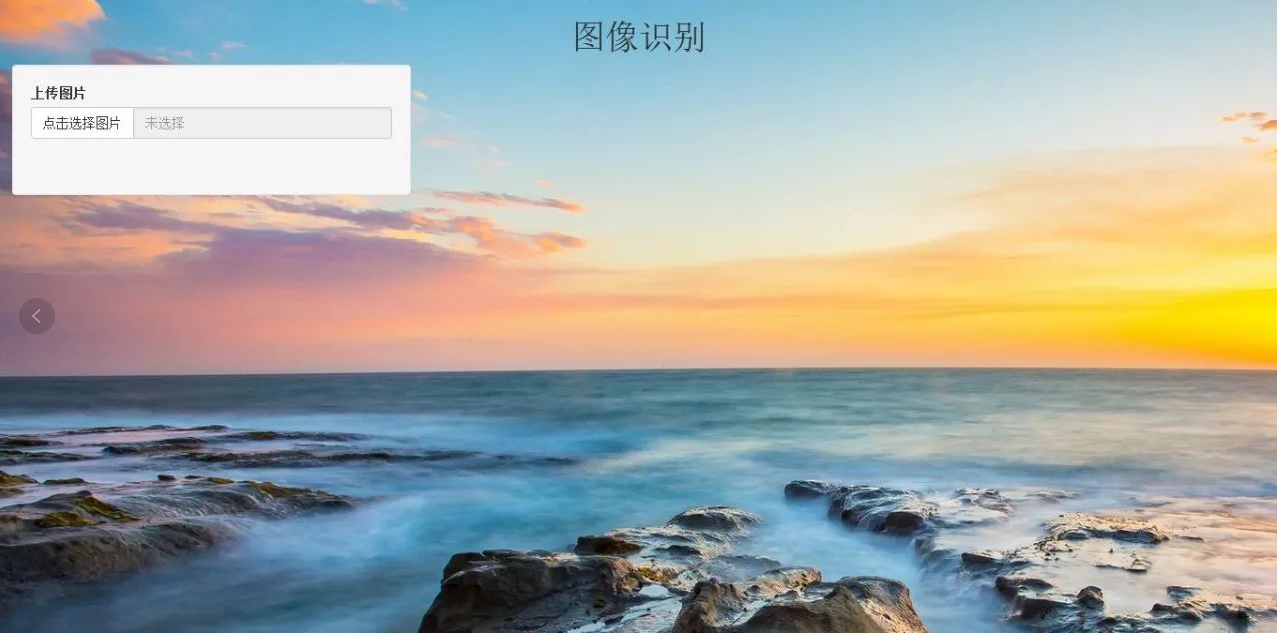
结果在Linux系统不知道怎么回事,CSS上面的背景图片加载不上了,底色也全是白色的,所以只能换成把背景改成单一色。

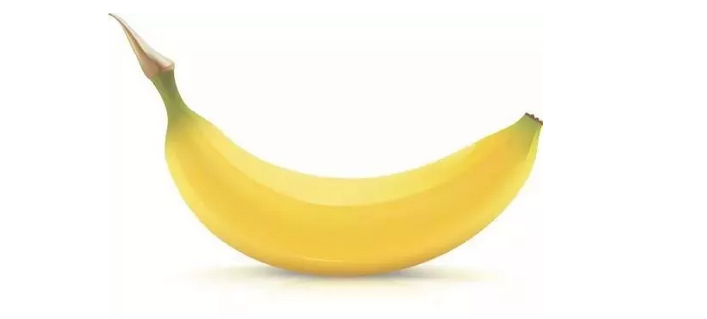
首先来大概演示一下效果,点击左边的点击选择图片,就会出现一个对话框再选择一张照片。这里我选择一张香蕉的照片来演示一下。这里识别时间多则20来秒,少则7,8秒。
运行结果如下图:

使用shiny可以使用很少代码做出一个非常棒的web项目。首先跟大家分享一下ui.R。
1. ui.R
library(shiny)# Define UI for application that draws a histogramshinyUI(


  fluidPage(

    includeCSS("style.css"),    # Application title

    div(style="text-align:center",headerPanel("图像识别")),    # Sidebar with a slider input for number of bins

    sidebarLayout(

      sidebarPanel(

        fileInput("image",label="上传图片",accept=c(".png",".jpg"),buttonLabel="点击选择图片", placeholder ="未选择")

      ),      # Show a plot of the generated distribution

      mainPanel(

        plotOutput("distPlot")

      )

    )

  )

)
2. Linux系统css代码
<head>

<style>

h{}

body{

    background-color: #225E79;

}

</style>

</head>
3. Windows系统css代码
<head>

<style>

h1 {

}

body {

  background-image: url(back.jpg);

    background-size: 100% 100% auto;

    position:absolute;

background-repeat: no-repeat;

}

</style>

</head>
back.jpg就是背景图片。
4. server.R
#

# This is the server logic of a Shiny web application. You can run the

# application by clicking 'Run App' above.

#

# Find out more about building applications with Shiny here:

#

#    http://shiny.rstudio.com/

#


library(shiny)

library(tensorflow) #加载TensorFlow包

library(magrittr) #数据处理包,可以使用管道函数

library(jpeg)

library(readr)

library(ggplot2)

library(grid) #图片处理的一个包,主要控制输出图形的大的外观和一些细节东西的排列

names = read_delim("imagenet_classes.txt", "\t", escape_double = FALSE, trim_ws = TRUE,col_names = FALSE)

slim= tf$contrib$slim #slim是一个使构建,训练,评估神经网络变得简单的库。

# slim提供了很多计算机视觉方面的著名模型(VGG, AlexNet等),我们不仅可以直接使用,甚至能以各种方式进行扩展。

shinyServer(

  function(input, output) {


  output$distPlot<-renderPlot(

    {

      inImages<-input$image

      if(is.null(inImages))

        return(NULL)


      tf$reset_default_graph() #在每次运行中清除当前图形,以避免变量重复


      #Session会话 张量的具体值和操作,会话关闭时,张量的任何具体值都会丢失


      images = tf$placeholder(tf$float32, shape(NULL, NULL, NULL, 3))# 创建占位符

      imgs_scaled = tf$image$resize_images(images, shape(224,224)) #设置图片大小


      # slim$conv2d自带卷积功能+激励函数

      fc8 = slim$conv2d(imgs_scaled, 64, shape(3,3), scope='vgg_16/conv1/conv1_1') %>%

        slim$conv2d(64, shape(3,3), scope='vgg_16/conv1/conv1_2')  %>%

        slim$max_pool2d( shape(2, 2), scope='vgg_16/pool1')  %>% #池化操作


        slim$conv2d(128, shape(3,3), scope='vgg_16/conv2/conv2_1')  %>%

        slim$conv2d(128, shape(3,3), scope='vgg_16/conv2/conv2_2')  %>%

        slim$max_pool2d( shape(2, 2), scope='vgg_16/pool2')  %>%


        slim$conv2d(256, shape(3,3), scope='vgg_16/conv3/conv3_1')  %>%

        slim$conv2d(256, shape(3,3), scope='vgg_16/conv3/conv3_2')  %>%

        slim$conv2d(256, shape(3,3), scope='vgg_16/conv3/conv3_3')  %>%

        slim$max_pool2d(shape(2, 2), scope='vgg_16/pool3')  %>%


        slim$conv2d(512, shape(3,3), scope='vgg_16/conv4/conv4_1')  %>%

        slim$conv2d(512, shape(3,3), scope='vgg_16/conv4/conv4_2')  %>%

        slim$conv2d(512, shape(3,3), scope='vgg_16/conv4/conv4_3')  %>%

        slim$max_pool2d(shape(2, 2), scope='vgg_16/pool4')  %>%


        slim$conv2d(512, shape(3,3), scope='vgg_16/conv5/conv5_1')  %>%

        slim$conv2d(512, shape(3,3), scope='vgg_16/conv5/conv5_2')  %>%

        slim$conv2d(512, shape(3,3), scope='vgg_16/conv5/conv5_3')  %>%

        slim$max_pool2d(shape(2, 2), scope='vgg_16/pool5')  %>%


        slim$conv2d(4096, shape(7, 7), padding='VALID', scope='vgg_16/fc6')  %>%

        slim$conv2d(4096, shape(1, 1), scope='vgg_16/fc7') %>%


        # Setting the activation_fn=NULL does not work, so we get a ReLU

        slim$conv2d(1000, shape(1, 1), scope='vgg_16/fc8')  %>%

        tf$squeeze(shape(1, 2), name='vgg_16/fc8/squeezed')


      tf$summary$FileWriter('/tmp/dumm/vgg16', tf$get_default_graph())$close() #保存在/tmp/dumm/vgg16目录下


      restorer = tf$train$Saver()#创建一个Saver 来管理模型中的所有变量。

      sess = tf$Session()

      restorer$restore(sess, 'vgg_16.ckpt')#复原模型


      img1<-readJPEG(inImages$datapath)

      d=dim(img1)  #获取img1的维度

      imgs =array(255*img1,dim = c(1,d[1],d[2],d[3]))


      fc8_vals=sess$run(fc8,dict(images=imgs))

      fc8_vals[1:5]


      probs=exp(fc8_vals)/sum(exp(fc8_vals))

      idx=sort.int(fc8_vals,index.return = TRUE,decreasing = TRUE)$ix[1:5]


      g = rasterGrob(img1, interpolate=TRUE)  #图形进行栅格化

      text = ""

      for (id in idx) {

        text = paste0(text, names[id,][[1]], " ", round(probs[id],5), "\n")

      }


      #annotate 添加文本注释

      #annotation_custom 可以添加各种图形元素到ggplot图中


      ggplot(data.frame(d=1:3)) + annotation_custom(g) +

        annotate('text',x=0.05,y=0.05,label=text, size=7, hjust = 0, vjust=0, color='blue') + xlim(0,1) + ylim(0,1)


    }

  )

})
使用shiny就这么简简单单的搭建一个系统处理,如果对网页编程懂的话还可以把界面做的更炫一些。