作者:晓哥、python哥 2016年10月21日
对R语言感兴趣的同学可以加微信:FridayBIfly,邀请到R语言学习群。
认识highchart
- Make your data come alive
- Make it easy for developers to set up interactive charts in their web pages
- 语法 hPlot(formula,data,type,group,size,title,subtitle,radius)其中type 主要包含 line;spline;scatter;bar;column;bubbom;pie;
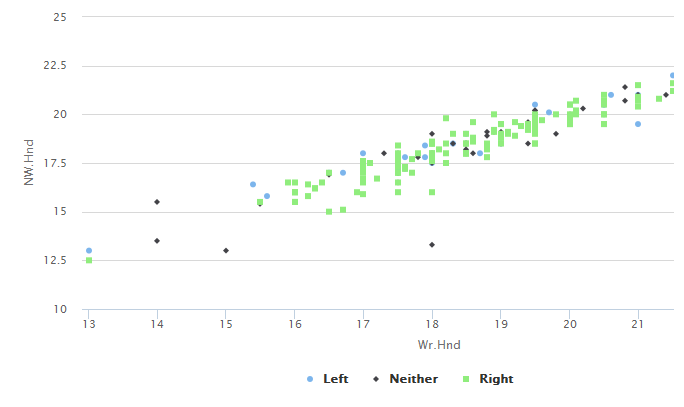
散点图-分组
library(rCharts)

hPlot(x = "Wr.Hnd", y = "NW.Hnd", data = MASS::survey, type = c("scatter"), group = "Clap", size = "Age")
气泡图
library(rCharts)

hPlot(x = "Wr.Hnd", y = "NW.Hnd", data = MASS::survey, type = c("bubble"),group = "Clap", size = "Age")

折线图
library(rCharts)

hPlot(x = "Wr.Hnd", y = "NW.Hnd", data = MASS::survey, type = c("line"), group = "Clap", size = "Age")

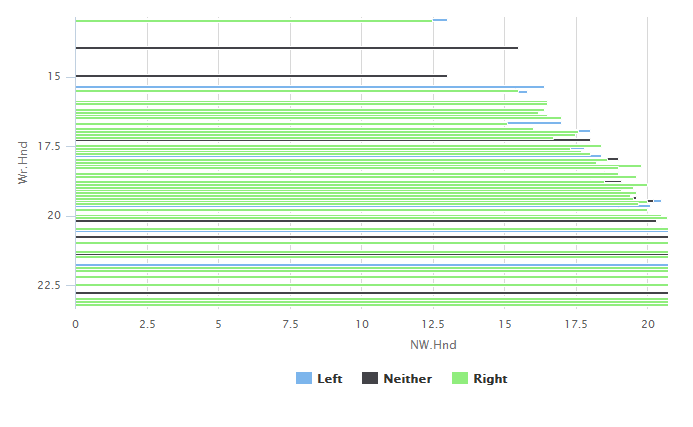
条形图
library(rCharts)

hPlot(x = "Wr.Hnd", y = "NW.Hnd", data = MASS::survey, type = c("bar"), group = "Clap", size = "Age")
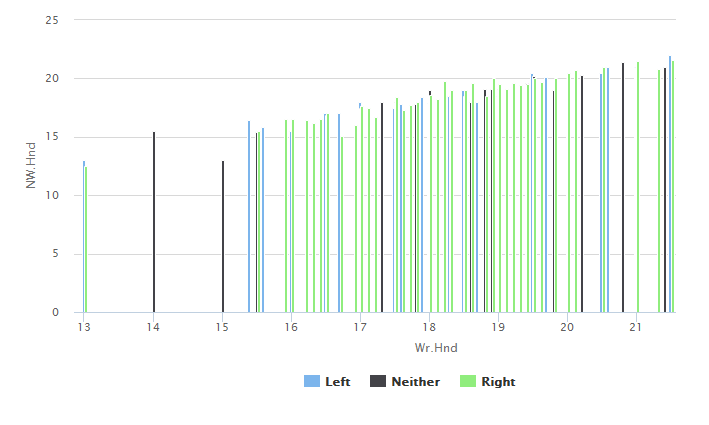
条形图
library(rCharts)

hPlot(x = "Wr.Hnd", y = "NW.Hnd", data = MASS::survey, type = c("column"), group = "Clap", size = "Age")
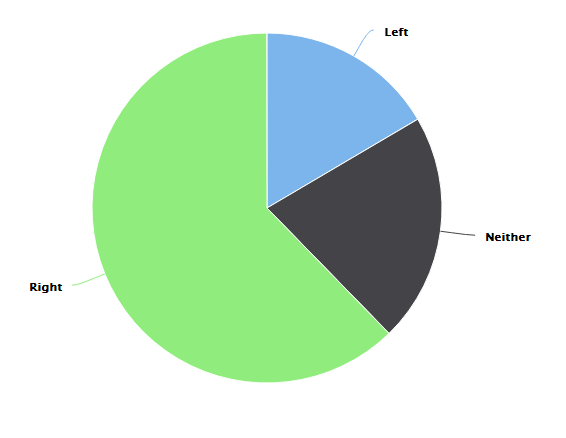
饼图
library(rCharts)

hPlot(~Clap, data = MASS::survey, type = c("pie"))
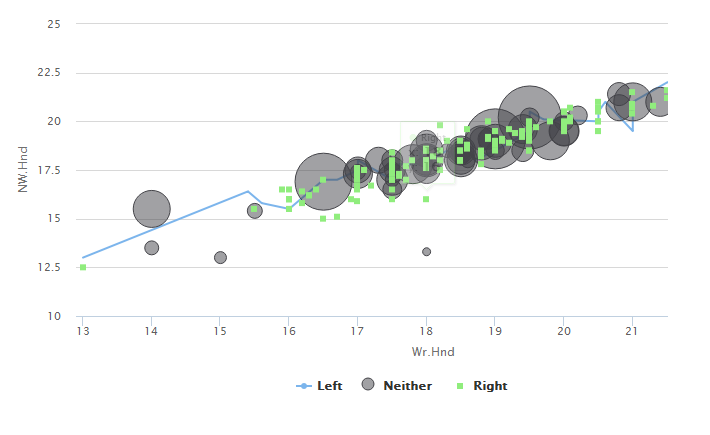
多图结合
hPlot(x = "Wr.Hnd", y = "NW.Hnd", data = MASS::survey, type = c("line",

    "bubble", "scatter"), group = "Clap", size = "Age")
更多
- 热力图,type为heatmap
- 仪表盘, type 为gauge
- 箱线图:type为boxplot
- 瀑布图: type 为waterfall
- 漏斗图: type 为waterfall
- 金字塔图 : type 为pyramid 此外,highchart还可以画3D图。更多详细内容请参考官网。
介绍一下个人经常用的桑基图
library(networkD3)

URL <- paste0(

        "https://cdn.rawgit.com/christophergandrud/networkD3/",

        "master/JSONdata/energy.json")

Energy <- jsonlite::fromJSON(URL)

# Plot

sankeyNetwork(Links = Energy$links, Nodes = Energy$nodes, Source = "source",

             Target = "target", Value = "value", NodeID = "name",

             units = "TWh", fontSize = 12, nodeWidth = 30)
网络图
library(networkD3)


# Create fake data

src <- c("A", "A", "A", "A",

        "B", "B", "C", "C", "D")

target <- c("B", "C", "D", "J",

            "E", "F", "G", "H", "I")

networkData <- data.frame(src, target)


# Plot

simpleNetwork(networkData)
表格图
library(DT)
##

## Attaching package: 'DT'
## The following object is masked from 'package:networkD3':

##

##     JS
对R语言感兴趣的同学可以加微信:FridayBIfly,邀请到R语言学习群。