** ggplot绘图,记住图层的概念。
ggplot2具体语法请参考: http://ggplot2.tidyverse.org/reference/
以下内容参考《R语言与数据挖掘》第五章
1,从qplot开始 (quick plot 快速作图)
## 使用格式
qplot(x, y = NULL, ..., data, facets = NULL, margins = FALSE,
geom = "auto", xlim = c(NA, NA), ylim = c(NA, NA), log = "",
main = NULL, xlab = deparse(substitute(x)),
ylab = deparse(substitute(y)), asp = NA, stat = NULL, position = NULL)
#facets 图形/数据的分面
#geom 图形的几何类型
#stat 图形的统计类型
#position 可以对图形或者数据位置进行调整
使用的数据集:鸢尾花iris
简单查看一下数据集的前6条数据,以及数据的基本情况。
> head(iris)

  Sepal.Length Sepal.Width Petal.Length Petal.Width Species

1          5.1         3.5          1.4         0.2  setosa

2          4.9         3.0          1.4         0.2  setosa

3          4.7         3.2          1.3         0.2  setosa

4          4.6         3.1          1.5         0.2  setosa

5          5.0         3.6          1.4         0.2  setosa

6          5.4         3.9          1.7         0.4  setosa
> summary(iris)

  Sepal.Length    Sepal.Width     Petal.Length    Petal.Width          Species

 Min.   :4.300   Min.   :2.000   Min.   :1.000   Min.   :0.100   setosa    :50

 1st Qu.:5.100   1st Qu.:2.800   1st Qu.:1.600   1st Qu.:0.300   versicolor:50

 Median :5.800   Median :3.000   Median :4.350   Median :1.300   virginica :50

 Mean   :5.843   Mean   :3.057   Mean   :3.758   Mean   :1.199

 3rd Qu.:6.400   3rd Qu.:3.300   3rd Qu.:5.100   3rd Qu.:1.800

 Max.   :7.900   Max.   :4.400   Max.   :6.900   Max.   :2.500
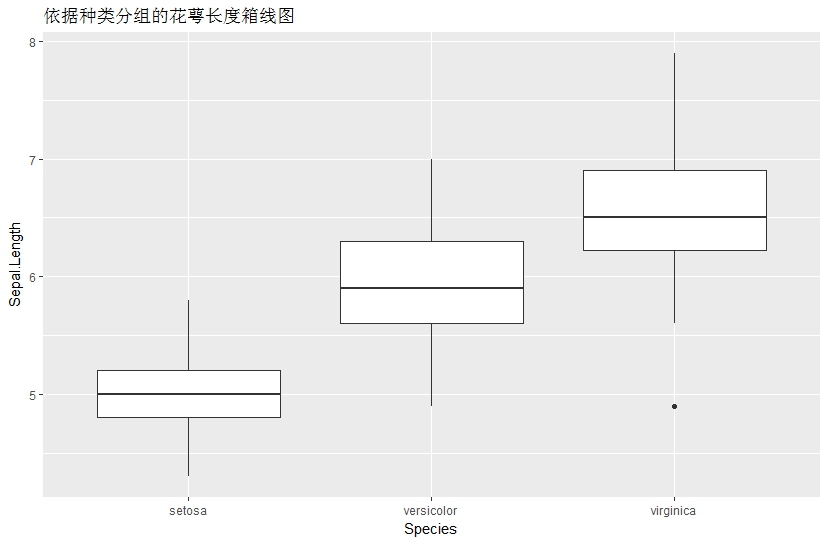
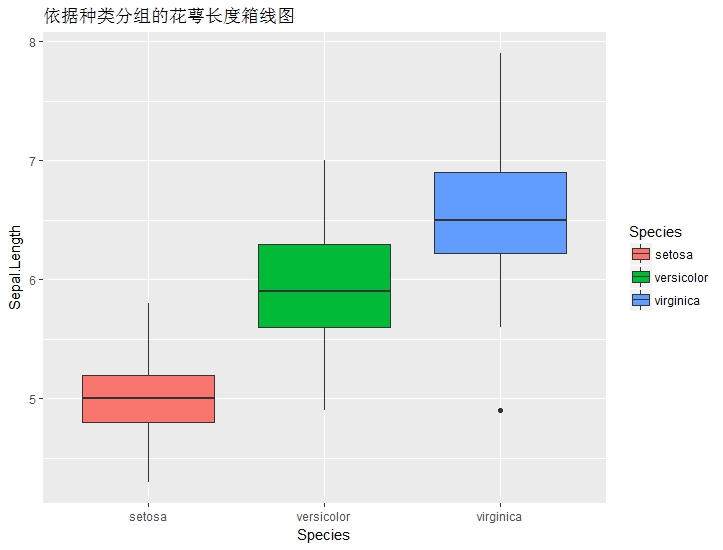
1.1 箱线图
qplot(Species,Sepal.Length,data = iris,geom = "boxplot",main = "依据种类分组的花萼长度箱线图")
#fill 填充颜色

qplot(Species,Sepal.Length,data = iris,geom = "boxplot",fill = Species,main = "依据种类分组的花萼长度箱线图")

# colour 箱体颜色

qplot(Species,Sepal.Length,data = iris,geom = "boxplot",colour = Species ,main = "依据种类分组的花萼长度箱线图")
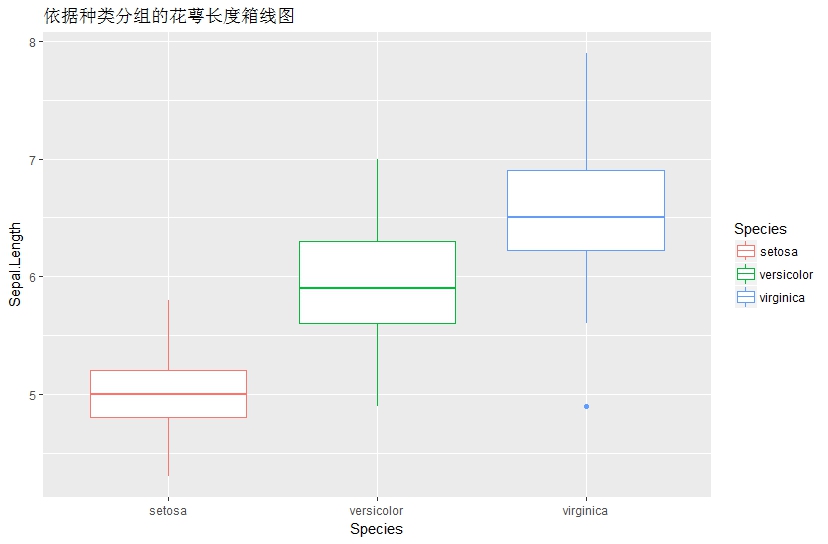
** 你发现不同了吗?
** fill ,colour,alpha分别为 填充,着色,透明度,将在另一篇中介绍。
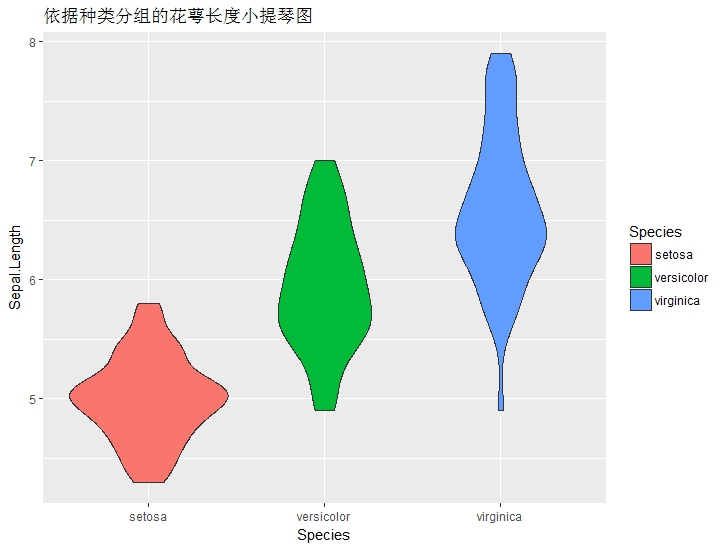
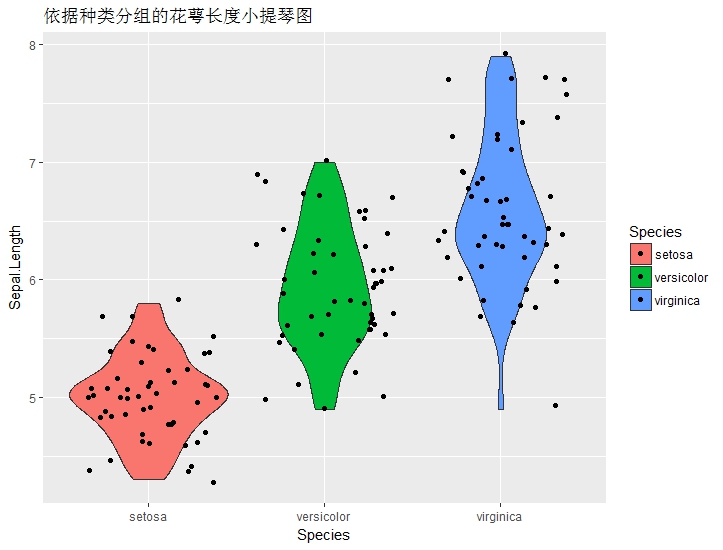
1.2 绘制小提琴图
# 绘制小提琴图

qplot(Species,Sepal.Length,data = iris,geom = "violin",fill = Species,main = "依据种类分组的花萼长度小提琴图")
# 增加数据噪音,较少数据重叠

qplot(Species,Sepal.Length,data = iris,geom = c("violin","jitter"),fill = Species,main = "依据种类分组的花萼长度小提琴图")
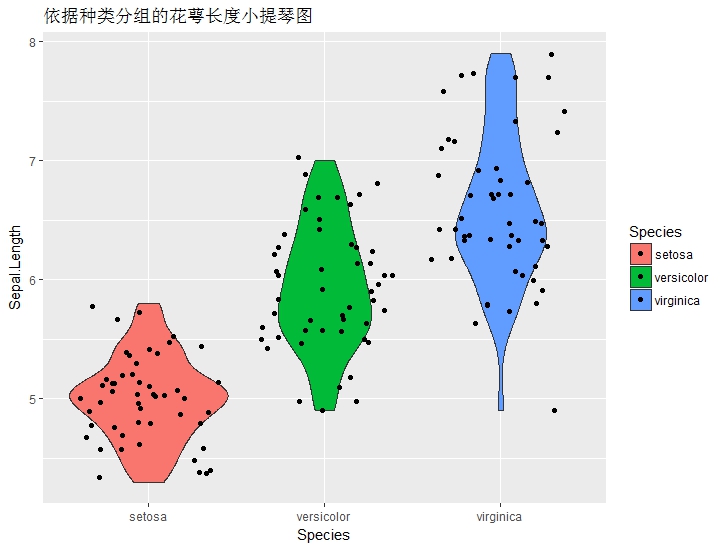
** 这里使用了 jitter (增加噪声函数,或者“扰动”)
请看jitter示例
> jitter(rep(0, 7))

[1] -7.344510e-03  9.450760e-03  1.776153e-02 -3.250232e-05  1.781715e-02 -1.231278e-02  1.603879e-02

> jitter(rep(10000, 5))

[1]  9996.651  9982.899  9999.104 10123.810 10191.734
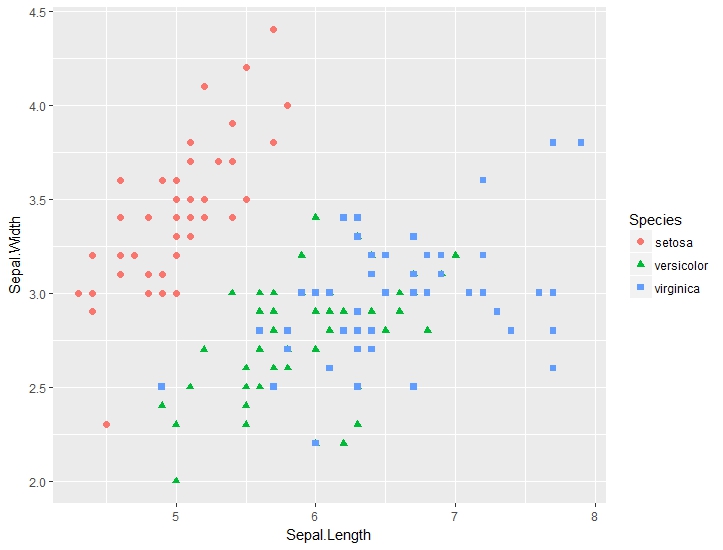
1.3 绘制散点图
## 绘制散点图
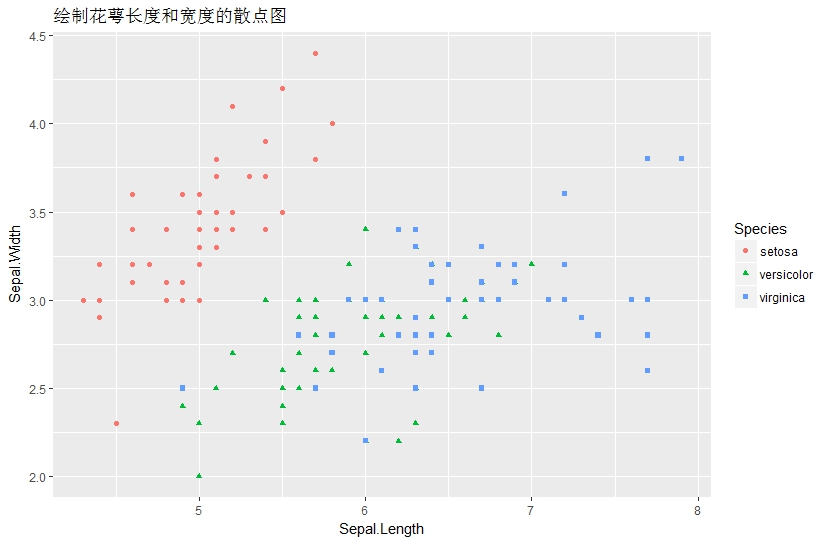
# 通过shape,colour,改变 点的颜色,形状
qplot(Sepal.Length,Sepal.Width,data = iris,colour = Species,shape = Species,main = "绘制花萼长度和宽度的散点图")
1.4 分面板散点图
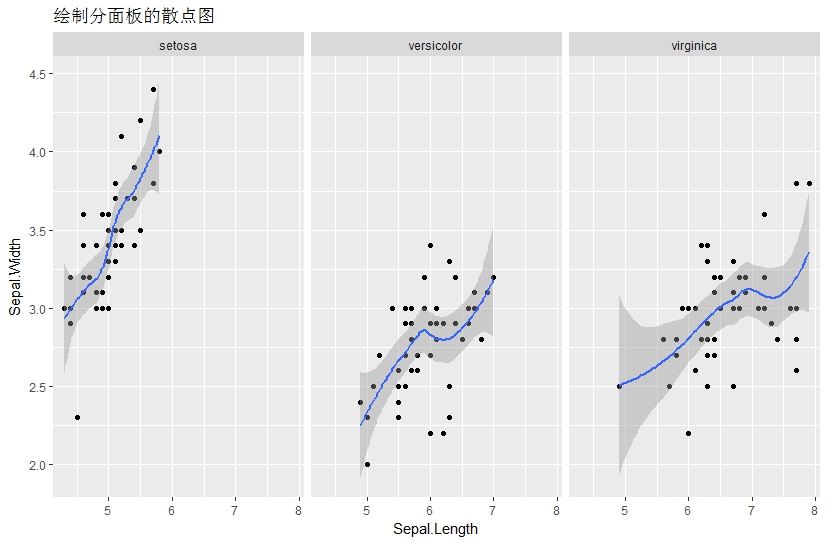
## 分面板散点图

# 通过facets ,分面板显示

qplot(Sepal.Length,Sepal.Width,data = iris,geom = c("point","smooth"),facets = ~Species ,main = "绘制分面板的散点图")
2,ggplot作图
2.1 ggplot()
# 初始化一个ggplot对象,不指定作图内容
2.2 layer()
# 创建一个新的图层
# layer(geom,stat,data,mapping,position)
# geom 图形的几何类型
# stat 图形的统计类型
# data 数据集
# mapping 映射
# position 对图形或者数据的位置进行调整
2.3 aes()
# 创建图形属性映射,将数据变量映射到图形中
2.4 ggplot 绘制箱线图
ggplot(iris,aes(x=Species,y=Sepal.Length,fill = Species)) + geom_boxplot() + labs(title='依据种类分组的花萼长度箱线图')
2.5 ggplot 绘制小提琴图
ggplot(iris,aes(x=Species,y=Sepal.Length,fill = Species)) + geom_violin()+geom_jitter() + labs(title='依据种类分组的花萼长度小提琴图')
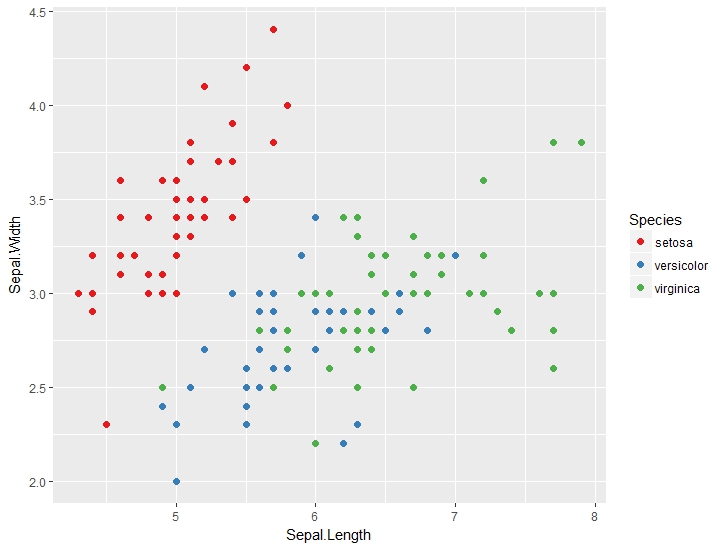
2.6 ggplot绘制散点图
ggplot(iris,aes(x=Sepal.Length,y=Sepal.Width,colour = Species,shape =Species)) + geom_point(size =2)
2.7 ggplot绘制分面板图
ggplot(iris,aes(x=Sepal.Length,y=Sepal.Width,fill = Species)) + geom_point() +geom_smooth()+facet_grid(.~Species)+labs(title='绘制分面板的散点图')

2.8 通过scale_color_brewer 改变颜色
ggplot(iris,aes(x=Sepal.Length,y=Sepal.Width,colour = Species)) + geom_point(size =2) + scale_color_brewer(palette = "Set1")
2.9 ggsave 保存图片
ggplot(iris,aes(x=Sepal.Length,y=Sepal.Width,colour = Species,shape =Species)) + geom_point(size =2)

ggsave(file = "ggplot-point.jpeg",width = 5,height = 4)
** 你会选择哪个绘图函数?