网上有很多制作词云的网站,我们使用Python也可以很方便的制作,这里,我们就简单学习下。
1. word_cloud
GitHub地址:https://github.com/amueller/word_cloud
首先我们需要安装,正常来说,直接就执行
pip install wordcloud
即可,但是,我这个是在Windows平台,安装的时候,提示什么少了,需要去下载个编译器的,报错信息后面有URL,
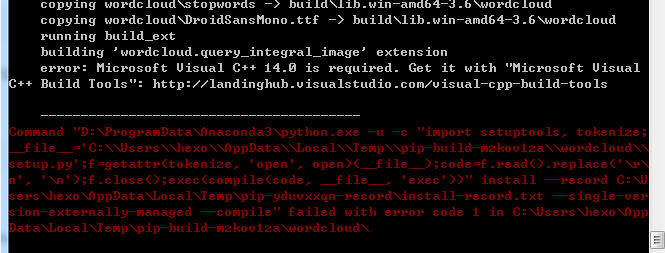
这里忘记记下来了,遇到的同学,直接去下载下应该就行了
error: Microsoft Visual C++ 14.0 is required
这里,我从网上找了另一个方法解决
去这个网站:http://www.lfd.uci.edu/~gohlke/pythonlibs/#wordcloud
找到指定的版本下载就行了
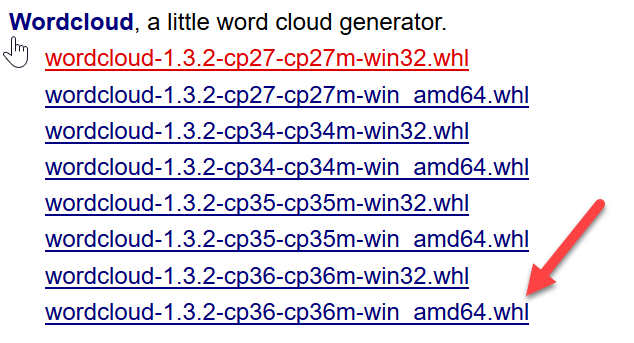
这里,我就下载了这个cp36的,然后直接安装就行了
pip install wordcloud-1.3.2-cp36-cp36m-win_amd64.whl
官网上有个小栗子,我们可以测试下,代码和使用到的数据,github上都有
from os import path

from wordcloud import WordCloud


d = path.dirname(__file__)


# Read the whole text.

text = open(path.join(d, 'constitution.txt')).read()


# Generate a word cloud image

wordcloud = WordCloud().generate(text)


# Display the generated image:

# the matplotlib way:

import matplotlib.pyplot as plt

plt.imshow(wordcloud, interpolation='bilinear')

plt.axis("off")


# lower max_font_size

wordcloud = WordCloud(max_font_size=40).generate(text)

plt.figure()

plt.imshow(wordcloud, interpolation="bilinear")

plt.axis("off")

plt.show()


# The pil way (if you don't have matplotlib)

# image = wordcloud.to_image()

# image.show()
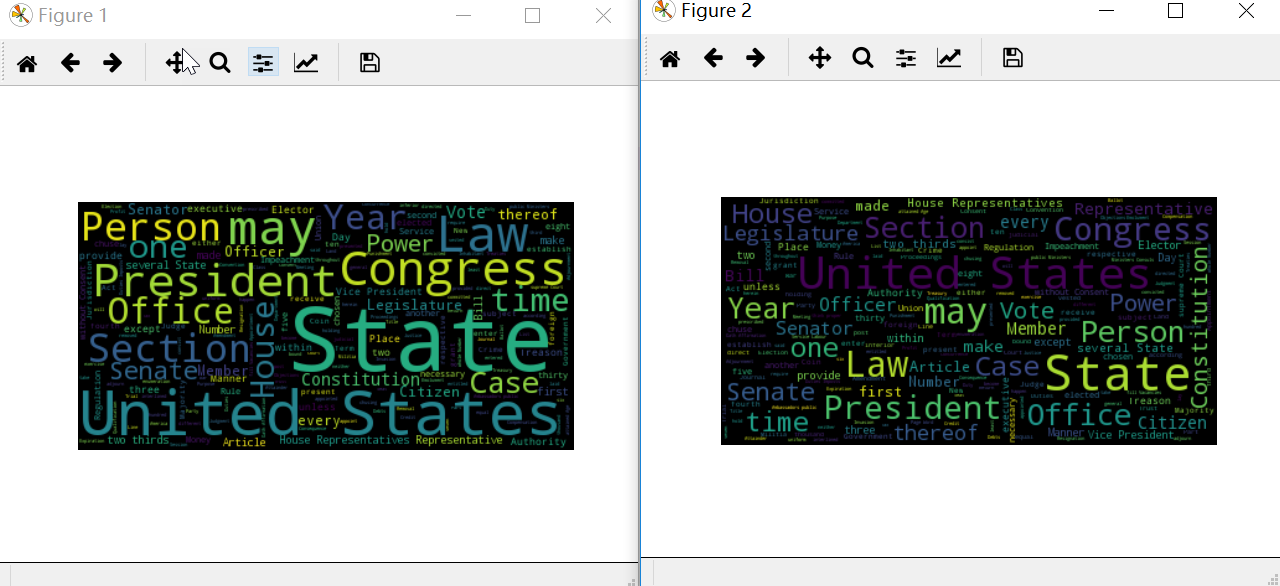
我们通过wordcloud生成了一个图片,然后使用matplotlib将图片展示出来,我们分析下上面的代码
matplotlib.pyplot.imshow(X, cmap=None, norm=None, aspect=None, interpolation=None, alpha=None, vmin=None, vmax=None, origin=None, extent=None, shape=None, filternorm=1, filterrad=4.0, imlim=None, resample=None, url=None, hold=None, data=None, **kwargs)


Display an image on the axes.
class wordcloud.WordCloud(font_path=None, width=400, height=200, margin=2, ranks_only=None, prefer_horizontal=0.9, mask=None, scale=1, color_func=None, max_words=200, min_font_size=4, stopwords=None, random_state=None, background_color='black', max_font_size=None, font_step=1, mode='RGB', relative_scaling=0.5, regexp=None, collocations=True, colormap=None, normalize_plurals=True)
这里有很多例子:https://amueller.github.io/word_cloud/auto_examples/index.html
2. 中文词云
上面,我们试试中文,我们换一个中文的文件试试即可
东方网记者王佳妮8月19日报道:8月18日晚,一则重磅消息在沪发布:即日起,上海暂停新增投放共享单车。上海市交通委表示,将采取有效措施,逐步解决共享单车快速发展带来的无序和不平衡问题,促进共享单车行业的持续健康发展。东方网记者从各平台获悉,将积极配合,同时考虑将中心城区部分车辆向郊区转移。
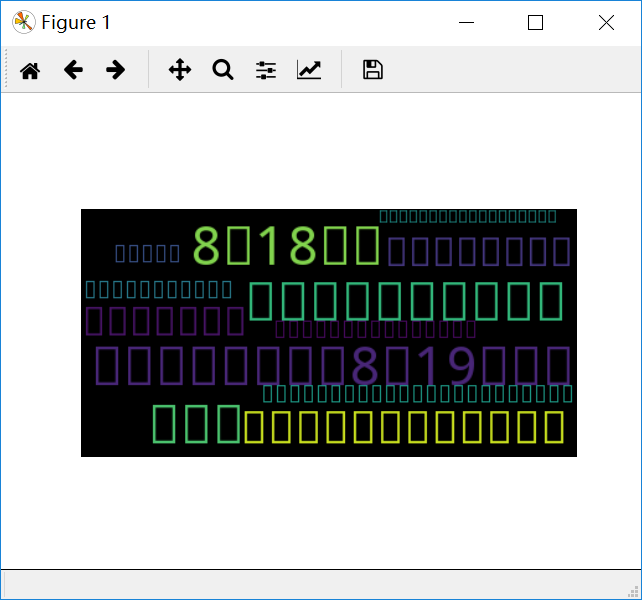
执行后,发现,中文都是乱码
我们观察上面wordcloud类,他有一个参数
font_path : string


    Font path to the font that will be used (OTF or TTF). Defaults to DroidSansMono path on a Linux machine. If you are on another OS or don’t have this font, you need to adjust this path.
这个可以指定为中文字体,
font = r'C:\Windows\Fonts\simsun.ttc'

# Generate a word cloud image

wordcloud = WordCloud(font_path=font).generate(text)
再次执行,中文可以正常显示了

但是,显示的并不是我们想要的,
正常词云的话,显示的是关键词,和他的出现频率有关,这里的话,并没有对文本内容做很好的分词
刚刚去简单整理了一个Python的分词:Python中文分词-jieba
这样,我们继续修改下上面的代码
from os import path

from wordcloud import WordCloud

import jieba


d = path.dirname(__file__)


# Read the whole text.

text = open(path.join(d, 'hello.txt'),encoding='utf-8').read()


text_cut = jieba.cut(text , cut_all=False)

font = r'C:\Windows\Fonts\simsun.ttc'

# Generate a word cloud image

wordcloud = WordCloud(font_path=font).generate(' '.join(text_cut))


# Display the generated image:

# the matplotlib way:

import matplotlib.pyplot as plt

plt.imshow(wordcloud, interpolation='bilinear')

plt.axis("off")
再次执行下
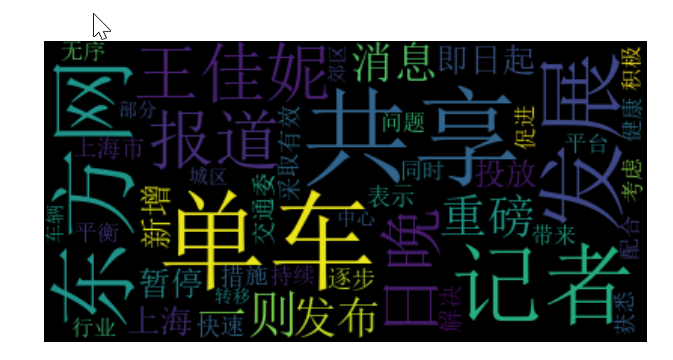
好嘞,这下差不多了,我们的中文词云图就搞好了
3. 自定义形状的词云图
下面,我们看看自定义形状的词云图,这里用官方的例子,就是需要多传入一个mask图片就行了
# -*- coding: utf-8 -*-

"""

Created on Sun Aug 20 14:04:48 2017


@author: yuguiyang

"""


from os import path

from PIL import Image

import numpy as np

import matplotlib.pyplot as plt


from wordcloud import WordCloud, STOPWORDS


d = path.dirname(__file__)


# Read the whole text.

text = open(path.join(d, 'alice.txt'),encoding='utf-8').read()


# read the mask image

# taken from

# http://www.stencilry.org/stencils/movies/alice%20in%20wonderland/255fk.jpg

alice_mask = np.array(Image.open(path.join(d, "alice_mask.png")))


stopwords = set(STOPWORDS)

stopwords.add("said")


wc = WordCloud(background_color="white", max_words=8000, mask=alice_mask,

               stopwords=stopwords)

# generate word cloud

wc.generate(text)


# store to file

wc.to_file(path.join(d, "alice.png"))


# show

plt.imshow(wc, interpolation='bilinear')

plt.axis("off")

plt.figure()

plt.imshow(alice_mask, cmap=plt.cm.gray, interpolation='bilinear')

plt.axis("off")

plt.show()
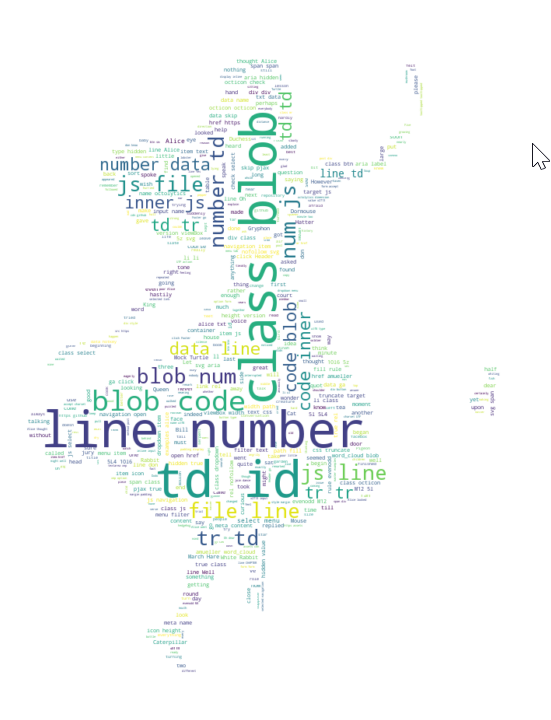
刚试了下,就是要找一个喜欢的图形图片,