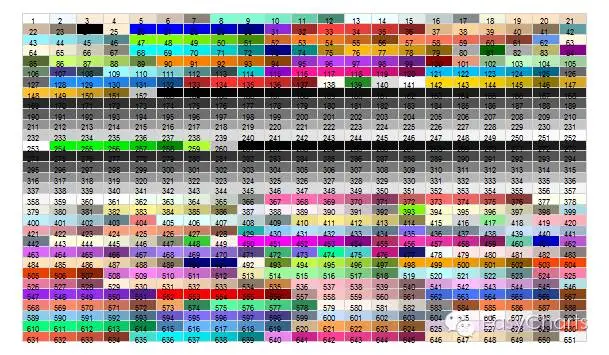
R语言中包含657种颜色,辅助我们画一幅漂亮的图片,本文介绍了R语言中颜色参考卡的获取以及常用的颜色配比方案。
获取颜色参考卡
#数字型
par(mar=c(0,0,0,0))
plot(0, 0, type = "n", xlim = c(0, 1), ylim = c(0, 1), axes = FALSE, xlab = "", ylab = "")
line=31
col=21
rect( rep((0:(col - 1)/col),line) , sort(rep((0:(line - 1)/line),col),decreasing=T) , rep((1:col/col),line) , sort(rep((1:line/line),col),decreasing=T),
border = "light gray" , col=colors()[seq(1,651)])
text( rep((0:(col - 1)/col),line)+0.02 , sort(rep((0:(line - 1)/line),col),decreasing=T)+0.01 , seq(1,651) , cex=0.5)
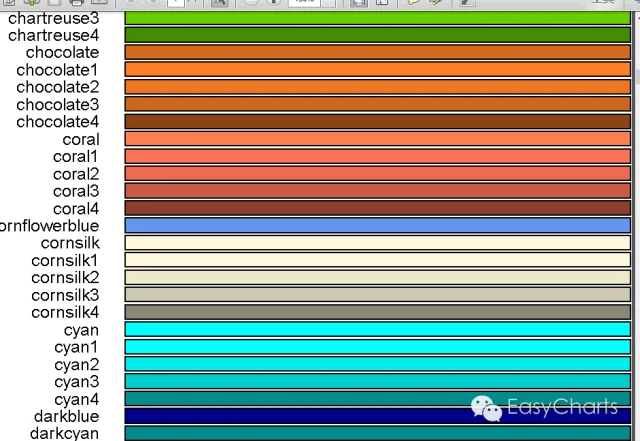
#标识型
par(mar=c(0,0,0,0))
plot(0, 0, type = "n", xlim = c(0, 1), ylim = c(0, 1), axes = FALSE, xlab = "", ylab = "")
line=25
col=5
rect( rep((0:(col - 1)/col),line) , sort(rep((0:(line - 1)/line),col),decreasing=T) , rep((1:col/col),line) , sort(rep((1:line/line),col),decreasing=T), border = "light gray" , col=colors()[seq(1,line*col)])
text( rep((0:(col - 1)/col),line)+0.1 , sort(rep((0:(line - 1)/line),col),decreasing=T)+0.015 , colors()[seq(1,line*col)] , cex=1)

#PDF

pdf('D:/colours.pdf', height = 120)

par(mar = c(0, 10, 3, 0)+0.1, yxs ='i')

barplot(rep(1, length(colours())), col = rev(colours()),

        names.arg = rev(colours()), horiz = TRUE, las = 1,

        xaxt = 'n', main = expression('Bars of colours in' ~ italic(colours())))

dev.off()
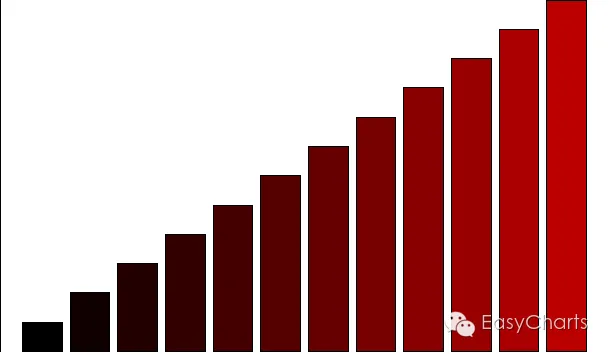
RGB取色
co = rgb((0:15)/15, green = 0, blue = 0, names = paste("red", 0:15, sep = "."))

barplot(1:12,col=co)
主题调色板
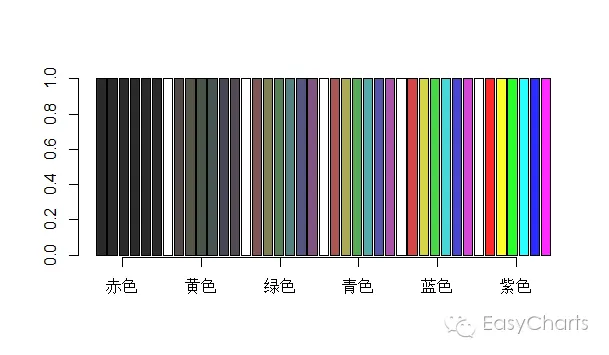
#rainbow()
barplot(rep(1,41),
col=c(rainbow(n=6, 0, 1/6),
'white',
rainbow(n=6, 1/6, 2/6),
'white',
rainbow(n=6, 2/6, 3/6),
'white',
rainbow(n=6, 3/6, 4/6),
'white',
rainbow(n=6, 4/6, 5/6),
'white',
rainbow(n=6, 5/6, 6/6)))
x.text <- c('赤色','黄色','绿色','青色','蓝色','紫色')
axis(side = 1, at=seq(from = 3, length.out = 6, by = 8.5),
labels = x.text, cex = 0.75)
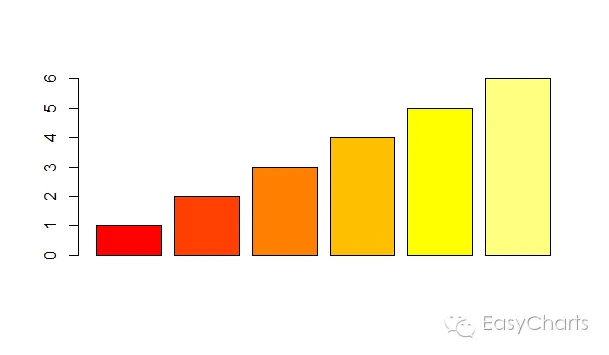
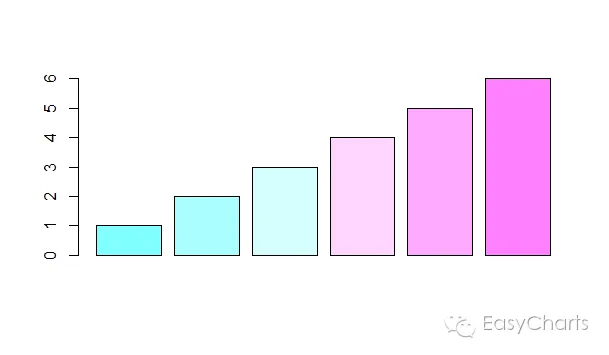
#heat.colors()

barplot(1:6, col = heat.colors(6))
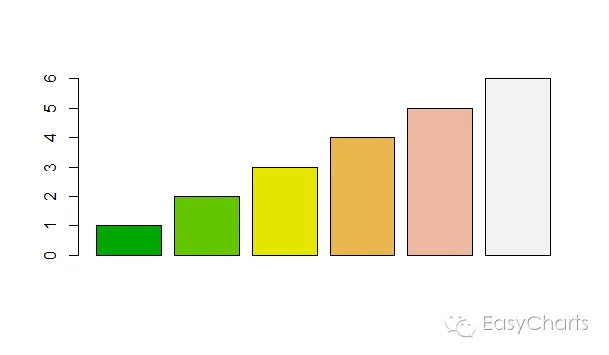
barplot(1:6, col = terrain.colors(6))
barplot(1:6, col = topo.colors(6))
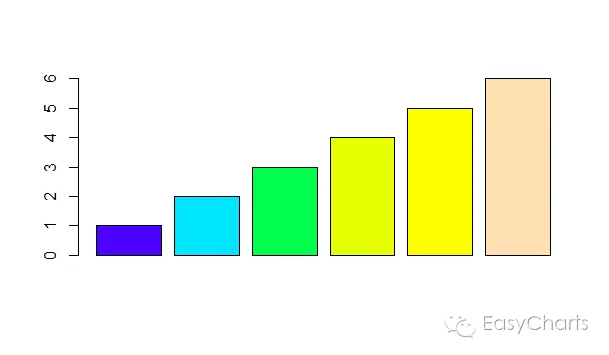
barplot(1:6, col = cm.colors(6))
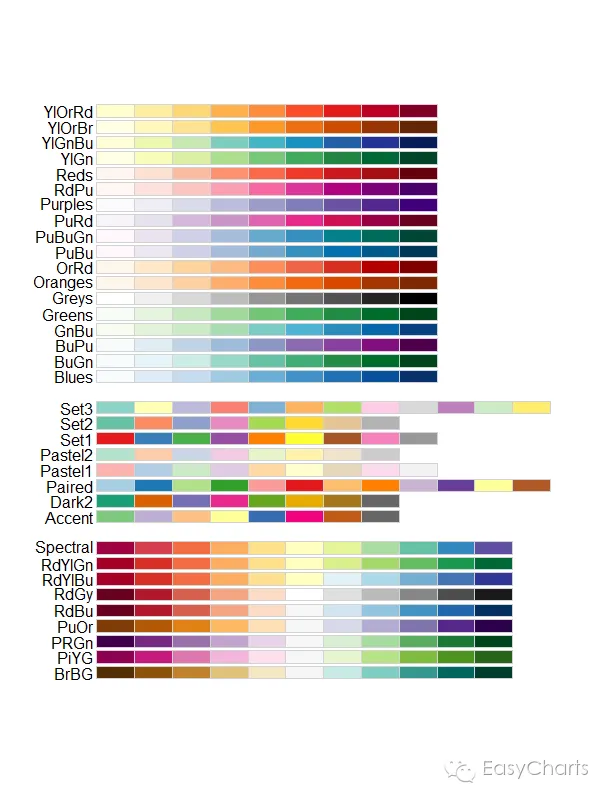
RColorBrewer颜色包
查看所有配色色
library(RColorBrewer)

display.brewer.all(type = 'all') #type=seq离散型, div极端型, qual离散型
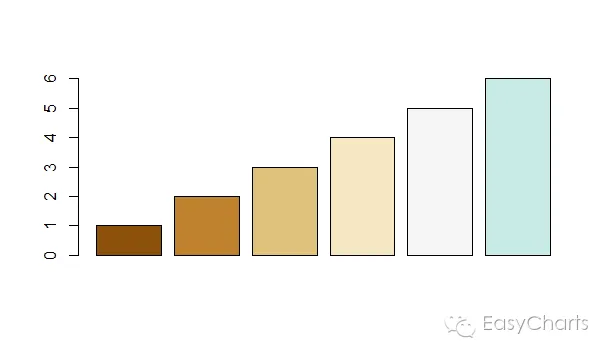
取色

brewer.pal(9,'BrBG')

barplot(1:6, col = brewer.pal(9,'BrBG')[1:6])

brewer.pal()
彩虹

# Red stripes

par(bg="black")

par(mar=c(0,0,0,0))

plot( 1 , 1 , xlim=c(0,100) , ylim=c(0,40) , col="black")

for(i in seq(-250,50,2)){

  abline(a = i, b = 0.3, col = rgb(sample(seq(0,1,0.001) , 1) ,sample(seq(0,1,0.001) , 1),sample(seq(0,1,0.001) , 1),0.7) , lwd=sample(seq(1:50),1) )

}

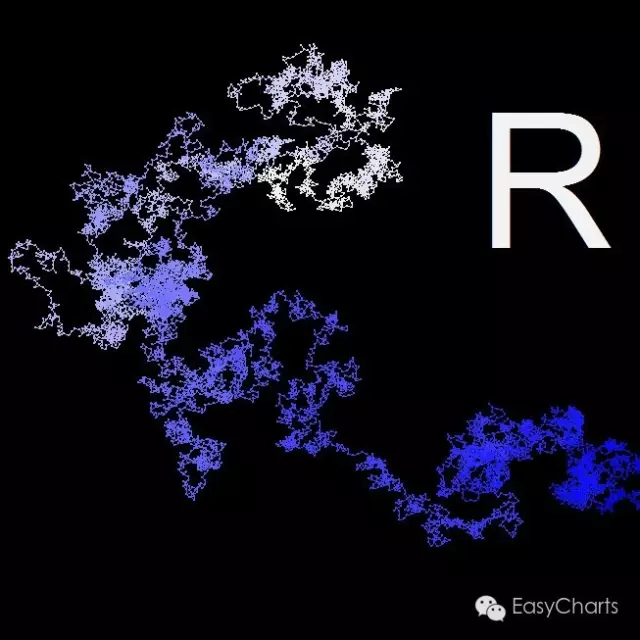
两幅漂亮的图
data<-numeric()
data<-readLines("http://www.apup.org/images/digits100000.txt") # orig. data source http://www.geom.uiuc.edu/~huberty/math5337/groupe/digits.html
# subset of 10'000 digits
dataA<-numeric()
dataA<-substr(data,1,10000)
# colors
pal <- colorRampPalette(c("#f2f2f2", "blue"))
colors <- pal(10000)
# image settings. here manually set limits (by visual eye).
dev.new(height=7,width=7)
par(bg="black", mar=c(0,0,0,0))
plot(x=0,y=0,xlim=c(-50,70), ylim=c(-100,40))
# initial values
a_x <- a_y <- numeric()
a_x <- 0; a_y <- 0;
# loop decimals. each digit (0-9) represents an individual angle.
for(i in 1:nchar(dataA)){
a<-b_x<-b_y<-numeric()
a<-as.numeric(substr(dataA,i,i))
b_x<-a_x+sin((2*pi/10)*(a)) # orig. y pos. + change
b_y<-a_y+cos((2*pi/10)*(a)) # orig. x pos. + change
# draw points. change colors.
points(x=c(a_x,b_x),y=c(a_y,b_y),type="l", col=colors[i])
points(x=c(b_x),y=c(b_y),pch=19, col=colors[i],cex=0.3)
# initialize next round
a_x<-b_x
a_y<-b_y
}
text(x=40, y=0, labels=expression(R), col="#f2f2f2", cex=12, pos=4) # title
text(x=52, y=10.6, labels="10000", col="black",cex=0.7, pos=4) # decimal amount
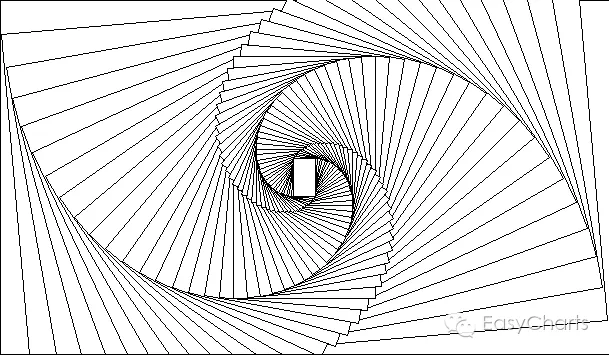
library(grid)


dev.new()

pushViewport(viewport(width=1, height=1, angle=0, name="vp1"))

grid.rect()


for(i in 1:54){

  pushViewport(viewport(width=0.95, height=0.95, angle=5, name="vp1"))

  grid.rect()


}