下面使用薛义书习题8.3 和8.4 来熟悉R 聚类分析
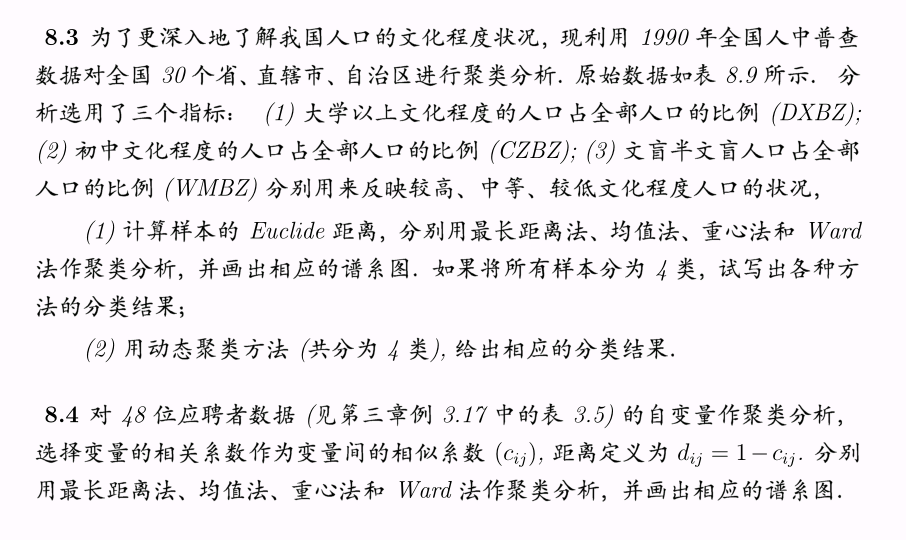
#8.3
DXBZ<-c(9.3, 4.67, 0.96, 1.38, 1.48, 2.6, 2.15, 2.14, 6.53, 1.47, 1.17, 0.88,
1.23, 0.99, 0.98, 0.85, 1.57, 1.14, 1.34, 0.79, 1.24, 0.96, 0.78, 0.81,
0.57, 1.67, 1.1, 1.49, 1.61, 1.85)
CZBZ<-c(30.55, 29.38, 24.69, 29.24, 25.47, 32.32, 26.31, 28.46, 31.59, 26.43,
23.74, 19.97, 16.87, 18.84, 25.18, 26.55, 23.16, 22.57, 23.04, 19.14, 22.53,
21.65, 14.65, 13.85, 3.85, 24.36, 16.85, 17.76, 20.27, 20.66)
WMBZ<-c(8.7, 8.92, 15.21, 11.3, 15.39, 8.81, 10.49, 10.87, 11.04, 17.23, 17.46,
24.43, 15.63, 16.22, 16.87, 16.15, 15.79, 12.1, 10.45, 10.61, 13.97, 16.24,
24.27, 25.44, 44.43, 17.62, 27.93, 27.7, 22.06, 12.75)
data8.3 <- cbind(DXBZ, CZBZ, WMBZ)
rownames(data8.3) = c("北京", "天津", "河北", "山西", "内蒙古", "辽宁","吉林", "黑龙江",
"上海", "江苏", "浙江", "安徽", "福建","江西", "山东", "河南", "湖北", "湖南", "广东",
"广西", "海南","四川", "贵州", "云南", "西藏", "陕西", "甘肃", "青海", "宁夏","新疆")
d <- dist(data8.3,method = "euclidean")
hc1<-hclust(d, method = "complete"); #最长距离法聚类
hc2<-hclust(d, method = "average"); #均值法聚类
hc3<-hclust(d, method = "centroid"); #重心法聚类
hc4<-hclust(d, method = "ward.D"); #Ward法聚类
par(mfrow=c(1,1))
plot(hc1,hang=-1)
rect.hclust(hc1, k=4,border="red")
plot(hc2,hang=-1)
rect.hclust(hc2, k=4,border="red");
plot(hc3,hang=-1)
rect.hclust(hc3, k=4,border="red");
plot(hc4,hang=-1)
rect.hclust(hc4, k=4,border="red");
clgroup1<-cutree(hc1, k = 4);sort(clgroup1);
clgroup2<-cutree(hc2, k = 4);sort(clgroup2);
clgroup3<-cutree(hc3, k = 4);sort(clgroup3);
clgroup4<-cutree(hc4, k = 4);sort(clgroup4);
#用动态聚类法聚类:
hc5<-kmeans(data8.3, 4);
sort(hc5$cluster);
#8.4
data8.4 <- read.csv("D:\\learn\\bigdata\\dataguru\\薛毅书源程序\\Chapter03\\applicant.csv")
d <- dist(1-cor(data8.4));#相似系数为scale(data8.4),本习题为相关系数
hc1 = hclust(d,"complete"); #最长距离法聚类
hc2 = hclust(d,"average"); #均值法聚类
hc3 = hclust(d,"centroid"); #重心法聚类
hc4 = hclust(d,"ward.D"); #Ward法聚类
#(1)绘制相应的谱系图
plot(hc1,hang=-1);rect.hclust(hc1, k=5,border="green");
plot(hc2,hang=-1);rect.hclust(hc2, k=5,border="green");
plot(hc3,hang=-1);rect.hclust(hc3, k=5,border="green");
plot(hc4,hang=-1);rect.hclust(hc4, k=5,border="green");
#(2)给出各省分类的具体结果:
clgroup1<-cutree(hc1, k = 5);sort(clgroup1);
clgroup2<-cutree(hc2, k = 5);sort(clgroup2);
clgroup3<-cutree(hc3, k = 5);sort(clgroup3);
clgroup4<-cutree(hc4, k = 5);sort(clgroup4);
