场景
客户反映有个显示错账功能要查询很久才能显示出来,全部查询出来的结果也不多就50多行。这个查询用的很频繁,要求进行性能提升。
Oracle 版本10.2.
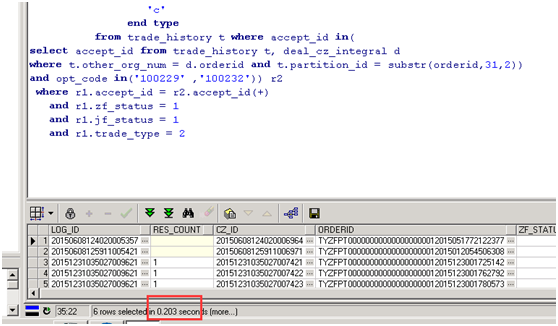
优化结果:由原来的180秒到最后的0.3秒
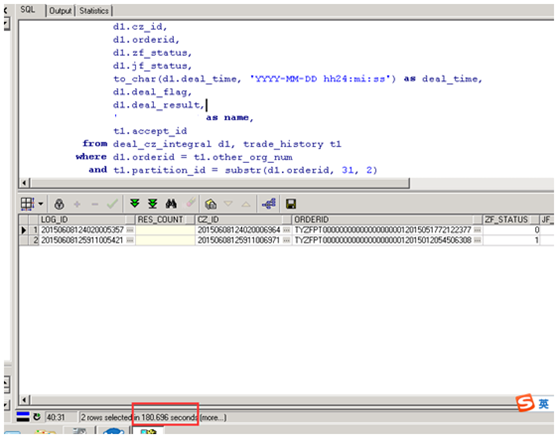
原始代码
select t1.log_id,

       '' as res_count,

       t1.cz_id,

       t1.orderid,

       t1.zf_status,

       t1.jf_status,

       to_char(t1.deal_time, 'YYYY-MM-DD hh24:mi:ss') as deal_time,

       t1.deal_flag,

       t1.deal_result,

       (case trade_type

         when 1 then

          'xx1'

         when 2 then

          'xx2'

       end) as name,

       'c' type

  from deal_cz_integral t1

 where (zf_status = 3 or zf_status = 0)

   and jf_status = 1

union all

select t2.log_id,

       '' as res_count,

       t2.cz_id,

       t2.orderid,

       t2.zf_status,

       t2.jf_status,

       to_char(t2.deal_time, 'YYYY-MM-DD hh24:mi:ss') as deal_time,

       t2.deal_flag,

       t2.deal_result,

       'xx1' as name,

       'q' type

  from deal_cz_integral t2

 where zf_status = 1

   and jf_status = 1

   and trade_type = 1

union all

select r1.log_id,

       case r2.res_count

         when '1' then

          '1'

         else

          '0'

       end as res_count,

       r1.cz_id,

       r1.orderid,

       r1.zf_status,

       r1.jf_status,

       r1.deal_time,

       r1.deal_flag,

       r1.deal_result,

       'xx2' as name,

       case r2.type

         when 'q' then

          'q'

         when 'c' then

          'c'

         else

          'b'

       end type

  from (select d1.trade_type,

               d1.log_id,

               d1.cz_id,

               d1.orderid,

               d1.zf_status,

               d1.jf_status,

               to_char(d1.deal_time, 'YYYY-MM-DD hh24:mi:ss') as deal_time,

               d1.deal_flag,

               d1.deal_result,

               'xx2' as name,

               t1.accept_id

          from deal_cz_integral d1, trade_history t1

         where d1.orderid = t1.other_org_num

           and t1.partition_id = substr(d1.orderid, 31, 2)

           and substr(t1.opt_code, 1, 6) = '100103') r1,

       (select accept_id,

               '1' res_count,

               case result

                 when '0' then

                  'q'

                 else

                  'c'

               end type

          from trade_history t where accept_id in(

select accept_id from trade_history t, deal_cz_integral d

where t.other_org_num = d.orderid and t.partition_id = substr(orderid,31,2))

and opt_code in('100229' ,'100232')) r2

 where r1.accept_id = r2.accept_id(+)

   and r1.zf_status = 1

   and r1.jf_status = 1

 and r1.trade_type = 2
解释计划
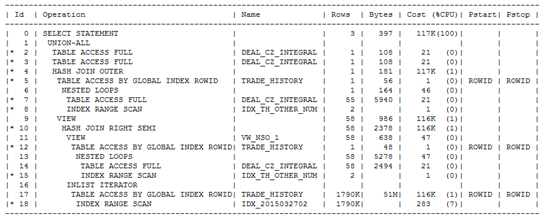
Predicate Information (identified by operation id):

	---------------------------------------------------

	   2 - filter(("ZF_STATUS"=0 OR "ZF_STATUS"=3) AND "JF_STATUS"=1)

	   3 - filter("TRADE_TYPE"=1 AND "ZF_STATUS"=1 AND "JF_STATUS"=1)

	   4 - access("T1"."ACCEPT_ID"="R2"."ACCEPT_ID"(+))

	   5 - filter(SUBSTR("T1"."OPT_CODE",1,6)='100103' AND

	              "T1"."PARTITION_ID"=TO_NUMBER(SUBSTR("D1"."ORDERID",31,2)))

	   7 - filter("D1"."ZF_STATUS"=1 AND "D1"."TRADE_TYPE"=2 AND "D1"."JF_STATUS"=1)

	   8 - access("D1"."ORDERID"="T1"."OTHER_ORG_NUM")

	  10 - access("ACCEPT_ID"="$nso_col_1")

	  12 - filter("T"."PARTITION_ID"=TO_NUMBER(SUBSTR("ORDERID",31,2)))

	  15 - access("T"."OTHER_ORG_NUM"="D"."ORDERID")

	  18 - access("OPT_CODE"='100229' OR "OPT_CODE"='100232')
执行时长:180秒
第一次优化
第一次优化 :虚拟索引模拟优化
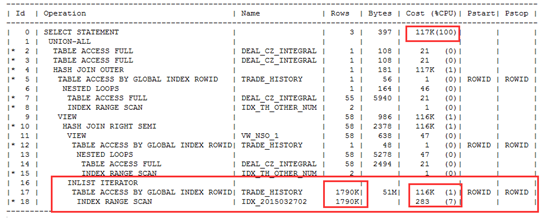
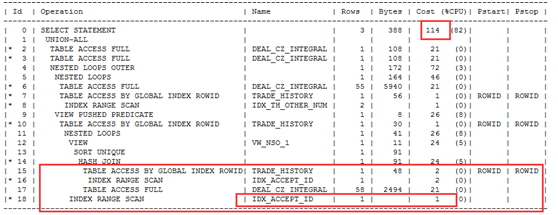
通过解释计划,我们发现主要cost在最后两行的回表上。如下图
根据前面执行的结果分析,整个语句执行出来共59行,而此预测结果(Cardnality列)达到1790k行,实在是夸张,想法降低这个预测返回结果或者不回表查询。首先我们要找到执行很慢这段代码。(观察代码发现有几个deal_cz_integral,trade_history ,我们可以运用命名查询块的方式+分析谓词信息,快速定位到底是哪个查询块出问题)
select accept_id,'1' res_count,caseresult when '0' then'q' else 'c' end type
from trade_history t where accept_id in(
select accept_id from trade_history t,deal_cz_integral d
where t.other_org_num = d.orderid andt.partition_id = substr(orderid,31,2))
and opt_code in('100229' ,'100232')
内层:select accept_id from trade_history t,deal_cz_integral d
where t.other_org_num = d.orderid andt.partition_id = substr(orderid,31,2)
查询出结果accept_id,共50多个
外层的:opt_code in('100229' ,'100232') 查询出结果accept_id,共1790k个,而且这1790k个是通过回表的方式TABLE ACCESS BY GLOBAL INDEXROWID 。
然后两者进行hash_ join right seme.
为什么要对这1790k数据回表查询accept_id呢,如果这个accept_id字段是索引字段?会是什么样的呢?是不是不用回表了。
通过上面的分析我们猜测可以通过创建accept_id索引,降低逻辑读(一般回表很多,逻辑读也会很多)。由于是生产库我们不能随便创建索引。因此我们先用虚拟索引查看如果创建accept_id 索引,会不会被使用。
SQL> alter session set "_use_nosegment_indexes"=true;

Session altered

SQL> create index IDX_ACCEPT_ID on trade_history(ACCEPT_ID) nosegment;

Index created

SQL> explain plan for xxx;

SQL> select * from table(dbms_xplan.display());
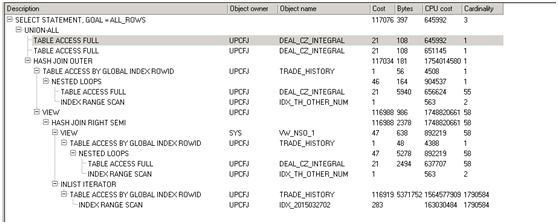
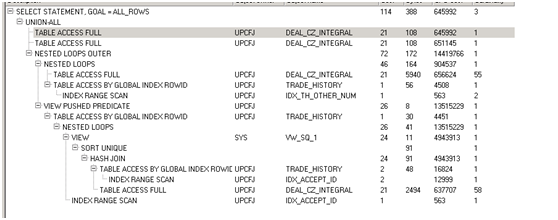
创建虚拟索引后解释计划对比
原解释计划:cost:117k rows:1790k
虚拟索引解释计划:cost :114 rows:1
两者对比发现如果创建了ACCEPT_ID性能可以得到极大的提高。因此我们可以创建ACCEPT_ID索引。进行第一次优化
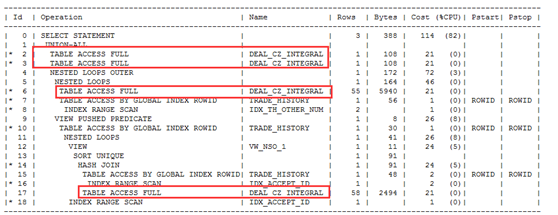
第一次优化后解释计划
第一次优化后执行时长:0.2秒
第二次优化
通过以上的创建索引性能得到大幅度提高,但是我们发现表deal_cz_integral,进行了四次全表扫描。现在该表中的数据量很小只有50多条,影响不是很明显,但是原则上我们还是要降低全表扫描的次数,优化方式通过with as方式
第二次优化后代码:略
第二次优化后的解释计划
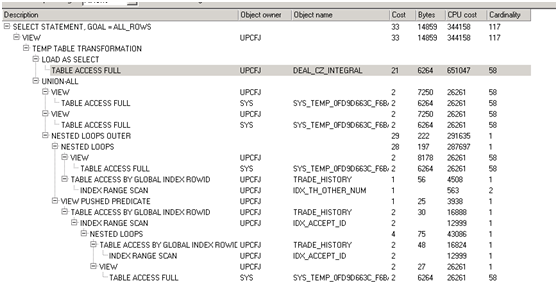
第二次优化后执行时长:0.03秒
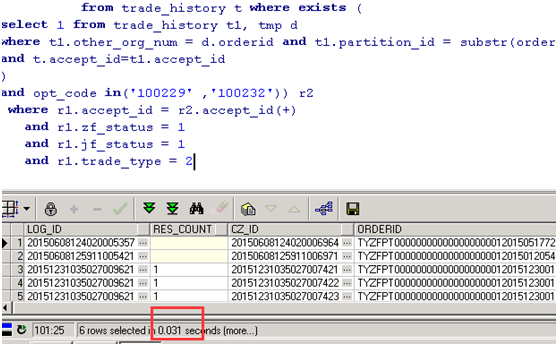
总结
1:根据解释计划谓词信息+查询块快速定位执行耗时的语句块
2:通过虚拟索引模拟索引的使用情况
3:降低全表扫描次数
