

作者:糖甜甜甜,R语言中文社区专栏作者
公众号:经管人学数据分析
前言
上篇文章中我们谈到R语言中shiny包用作企业业务数据轻量级web开发的好处,
R+ECharts2Shiny实现web动态交互式可视化数据(上),在这篇文章中我们推荐下在Shiny Gallery上的用shiny开发出来的优秀网站,部分网站有代码,大家可以在R中直接运行出来查看。
Shiny APP!
1.世界人口前景可视化web应用

GitHub地址:https://github.com/PPgp/wppExplorer
2.城市交通实时可视化web应用
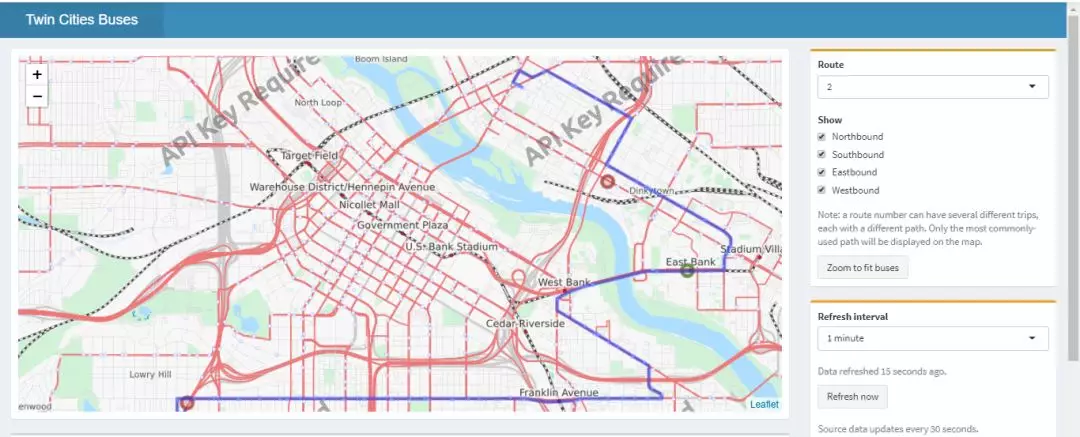
GitHub地址:https://github.com/rstudio/shiny-examples/tree/master/086-bus-dashboard
3.美国非盈利大学可视化web应用

4.警力实时数据可视化web应用
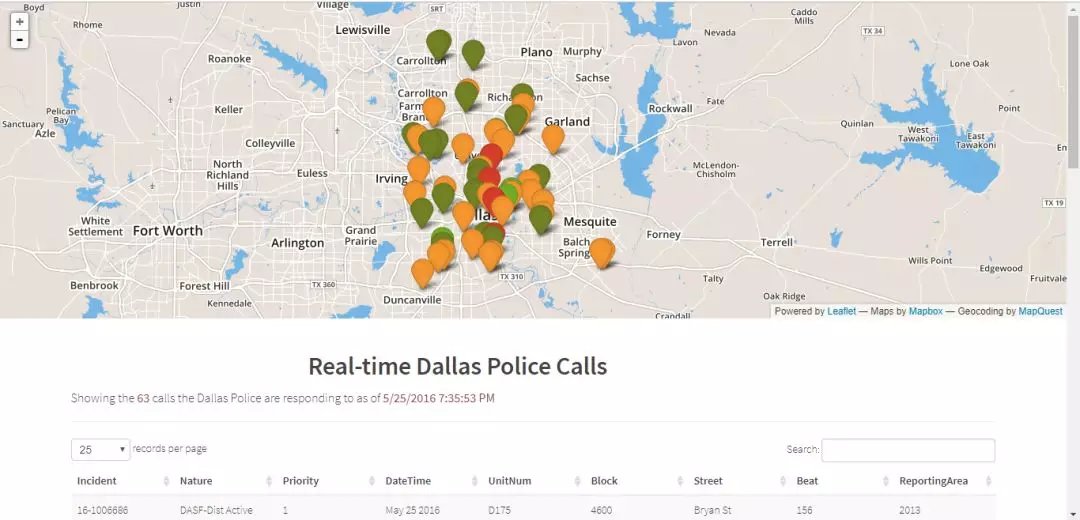
GitHub地址:https://github.com/trestletech/dallas-police/
web应用中的部分功能的实现
以下的代码可以直接复制粘贴在R中实现,通过从小功能的实现学习shiny包,平时爬取的数据可以选择自己用R或python搭一个轻量级的web,为数据提供更多的价值,并且这样的作品拿出来在面试数据分析职位会加不少分哟。
1.交互
在调用server函数,申明一个交互对象datasetInput,交互函数reactive用来对UI中的输入进行处理,依赖于input$dataset,然后被output调用,这里的数据可以是自己设定,excel、csv或者数据库都可以。
 1library(shiny)
 2
 3# Define UI for dataset viewer app ----
 4ui <- fluidPage(
 5
 6  # App title ----
 7  titlePanel("Reactivity"),
 8
 9  # Sidebar layout with input and output definitions ----
10  sidebarLayout(
11
12    # Sidebar panel for inputs ----
13    sidebarPanel(
14
15      # Input: Text for providing a caption ----
16      textInput(inputId = "caption",
17                label = "Caption:",
18                value = "Data Summary"),
19
20      # Input: Selector for choosing dataset ----
21      selectInput(inputId = "dataset",
22                  label = "Choose a dataset:",
23                  choices = c("rock", "pressure", "cars")),
24
25      # Input: Numeric entry for number of obs to view ----
26      numericInput(inputId = "obs",
27                   label = "Number of observations to view:",
28                   value = 10)
29
30    ),
31
32    # Main panel for displaying outputs ----
33    mainPanel(
34
35      # Output: Formatted text for caption ----
36      h3(textOutput("caption", container = span)),
37
38      # Output: Verbatim text for data summary ----
39      verbatimTextOutput("summary"),
40
41      # Output: HTML table with requested number of observations ----
42      tableOutput("view")
43
44    )
45  )
46)
47
48# Define server logic to summarize and view selected dataset ----
49server <- function(input, output) {
50
51  # Return the requested dataset ----
52  datasetInput <- reactive({
53    switch(input$dataset,
54           "rock" = rock,
55           "pressure" = pressure,
56           "cars" = cars)
57  })
58
59  # Create caption ----
60  output$caption <- renderText({
61    input$caption
62  })
63
64  # Generate a summary of the dataset ----
65  output$summary <- renderPrint({
66    dataset <- datasetInput()
67    summary(dataset)
68  })
69
70  # Show the first "n" observations ----
71  output$view <- renderTable({
72    head(datasetInput(), n = input$obs)
73  })
74}
75
76shinyApp(ui, server)
2.控件
shiny中关于控件的函数比较多,不同的数据输入可以由多个控件来控制,更方便的由各个业务角度来展示数据。
 1library(shiny)
 2
 3# Define UI for slider demo app ----
 4ui <- fluidPage(
 5
 6  # App title ----
 7  titlePanel("Sliders"),
 8
 9  # Sidebar layout with input and output definitions ----
10  sidebarLayout(
11
12    # Sidebar to demonstrate various slider options ----
13    sidebarPanel(
14
15      # Input: Simple integer interval ----
16      sliderInput("integer", "Integer:",
17                  min = 0, max = 1000,
18                  value = 500),
19
20      # Input: Decimal interval with step value ----
21      sliderInput("decimal", "Decimal:",
22                  min = 0, max = 1,
23                  value = 0.5, step = 0.1),
24
25      # Input: Specification of range within an interval ----
26      sliderInput("range", "Range:",
27                  min = 1, max = 1000,
28                  value = c(200,500)),
29
30      # Input: Custom currency format for with basic animation ----
31      sliderInput("format", "Custom Format:",
32                  min = 0, max = 10000,
33                  value = 0, step = 2500,
34                  pre = "$", sep = ",",
35                  animate = TRUE),
36
37      # Input: Animation with custom interval (in ms) ----
38      # to control speed, plus looping
39      sliderInput("animation", "Looping Animation:",
40                  min = 1, max = 2000,
41                  value = 1, step = 10,
42                  animate =
43                    animationOptions(interval = 300, loop = TRUE))
44
45    ),
46
47    # Main panel for displaying outputs ----
48    mainPanel(
49
50      # Output: Table summarizing the values entered ----
51      tableOutput("values")
52
53    )
54  )
55)
56
57# Define server logic for slider examples ----
58server <- function(input, output) {
59
60  # Reactive expression to create data frame of all input values ----
61  sliderValues <- reactive({
62
63    data.frame(
64      Name = c("Integer",
65               "Decimal",
66               "Range",
67               "Custom Format",
68               "Animation"),
69      Value = as.character(c(input$integer,
70                             input$decimal,
71                             paste(input$range, collapse = " "),
72                             input$format,
73                             input$animation)),
74      stringsAsFactors = FALSE)
75
76  })
77
78  # Show the values in an HTML table ----
79  output$values <- renderTable({
80    sliderValues()
81  })
82
83}
84
85# Create Shiny app ----
86shinyApp(ui, server)
3.UI引用HTML文件
UI可以完全引用HTML文件,为用户界面加上丰富的样式和交互,但是写HTML文件需要了解html、css和js等内容。
UI部分的.html
 1<html>
 2
 3<head>
 4  <script src="shared/jquery.js" type="text/javascript"></script>
 5  <script src="shared/shiny.js" type="text/javascript"></script>
 6  <link rel="stylesheet" type="text/css" href="shared/shiny.css"/>
 7</head>
 8
 9<body>
10
11  <h1>HTML UI</h1>
12
13  <p>
14    <label>Distribution type:</label><br />
15    <select name="dist">
16      <option value="norm">Normal</option>
17      <option value="unif">Uniform</option>
18      <option value="lnorm">Log-normal</option>
19      <option value="exp">Exponential</option>
20    </select>
21  </p>
22
23  <p>
24
25    <label>Number of observations:</label><br />
26    <input type="number" name="n" value="500" min="1" max="1000" />
27
28  </p>
29
30  <h3>Summary of data:</h3>
31  <pre id="summary" class="shiny-text-output"></pre>
32
33  <h3>Plot of data:</h3>
34  <div id="plot" class="shiny-plot-output"
35       style="width: 100%; height: 300px"></div>
36
37  <h3>Head of data:</h3>
38  <div id="table" class="shiny-html-output"></div>
39
40</body>
41</html>
server.R
 1library(shiny)
 2
 3# Define server logic for random distribution app ----
 4server <- function(input, output) {
 5
 6  # Reactive expression to generate the requested distribution ----
 7  # This is called whenever the inputs change. The output functions
 8  # defined below then use the value computed from this expression
 9  d <- reactive({
10    dist <- switch(input$dist,
11                   norm = rnorm,
12                   unif = runif,
13                   lnorm = rlnorm,
14                   exp = rexp,
15                   rnorm)
16
17    dist(input$n)
18  })
19
20  # Generate a plot of the data ----
21  # Also uses the inputs to build the plot label. Note that the
22  # dependencies on the inputs and the data reactive expression are
23  # both tracked, and all expressions are called in the sequence
24  # implied by the dependency graph.
25  output$plot <- renderPlot({
26    dist <- input$dist
27    n <- input$n
28
29    hist(d(),
30         main = paste("r", dist, "(", n, ")", sep = ""),
31         col = "#75AADB", border = "white")
32  })
33
34  # Generate a summary of the data ----
35  output$summary <- renderPrint({
36    summary(d())
37  })
38
39  # Generate an HTML table view of the head of the data ----
40  output$table <- renderTable({
41    head(data.frame(x = d()))
42  })
43
44}
45
46# Create Shiny app ----
47shinyApp(ui = htmlTemplate("www/index.html"), server)
4.文件上传
在UI部分加入fileInput函数,在server函数中用input$file来实现文件上载功能。
  1library(shiny)
  2
  3# Define UI for data upload app ----
  4ui <- fluidPage(
  5
  6  # App title ----
  7  titlePanel("Uploading Files"),
  8
  9  # Sidebar layout with input and output definitions ----
 10  sidebarLayout(
 11
 12    # Sidebar panel for inputs ----
 13    sidebarPanel(
 14
 15      # Input: Select a file ----
 16      fileInput("file1", "Choose CSV File",
 17                multiple = FALSE,
 18                accept = c("text/csv",
 19                         "text/comma-separated-values,text/plain",
 20                         ".csv")),
 21
 22      # Horizontal line ----
 23      tags$hr(),
 24
 25      # Input: Checkbox if file has header ----
 26      checkboxInput("header", "Header", TRUE),
 27
 28      # Input: Select separator ----
 29      radioButtons("sep", "Separator",
 30                   choices = c(Comma = ",",
 31                               Semicolon = ";",
 32                               Tab = "\t"),
 33                   selected = ","),
 34
 35      # Input: Select quotes ----
 36      radioButtons("quote", "Quote",
 37                   choices = c(None = "",
 38                               "Double Quote" = '"',
 39                               "Single Quote" = "'"),
 40                   selected = '"'),
 41
 42      # Horizontal line ----
 43      tags$hr(),
 44
 45      # Input: Select number of rows to display ----
 46      radioButtons("disp", "Display",
 47                   choices = c(Head = "head",
 48                               All = "all"),
 49                   selected = "head")
 50
 51    ),
 52
 53    # Main panel for displaying outputs ----
 54    mainPanel(
 55
 56      # Output: Data file ----
 57      tableOutput("contents")
 58
 59    )
 60
 61  )
 62)
 63
 64# Define server logic to read selected file ----
 65server <- function(input, output) {
 66
 67  output$contents <- renderTable({
 68
 69    # input$file1 will be NULL initially. After the user selects
 70    # and uploads a file, head of that data file by default,
 71    # or all rows if selected, will be shown.
 72
 73    req(input$file1)
 74
 75    # when reading semicolon separated files,
 76    # having a comma separator causes `read.csv` to error
 77    tryCatch(
 78      {
 79        df <- read.csv(input$file1$datapath,
 80                 header = input$header,
 81                 sep = input$sep,
 82                 quote = input$quote)
 83      },
 84      error = function(e) {
 85        # return a safeError if a parsing error occurs
 86        stop(safeError(e))
 87      }
 88    )
 89
 90    if(input$disp == "head") {
 91      return(head(df))
 92    }
 93    else {
 94      return(df)
 95    }
 96
 97  })
 98
 99}
100
101# Create Shiny app ----
102shinyApp(ui, server)
5.文件下载
在UI部分使用downloadButton函数,在server函数中用downloadHandler来实现文件下载功能。
 1library(shiny)
 2
 3# Define UI for data download app ----
 4ui <- fluidPage(
 5
 6  # App title ----
 7  titlePanel("Downloading Data"),
 8
 9  # Sidebar layout with input and output definitions ----
10  sidebarLayout(
11
12    # Sidebar panel for inputs ----
13    sidebarPanel(
14
15      # Input: Choose dataset ----
16      selectInput("dataset", "Choose a dataset:",
17                  choices = c("rock", "pressure", "cars")),
18
19      # Button
20      downloadButton("downloadData", "Download")
21
22    ),
23
24    # Main panel for displaying outputs ----
25    mainPanel(
26
27      tableOutput("table")
28
29    )
30
31  )
32)
33
34# Define server logic to display and download selected file ----
35server <- function(input, output) {
36
37  # Reactive value for selected dataset ----
38  datasetInput <- reactive({
39    switch(input$dataset,
40           "rock" = rock,
41           "pressure" = pressure,
42           "cars" = cars)
43  })
44
45  # Table of selected dataset ----
46  output$table <- renderTable({
47    datasetInput()
48  })
49
50  # Downloadable csv of selected dataset ----
51  output$downloadData <- downloadHandler(
52    filename = function() {
53      paste(input$dataset, ".csv", sep = "")
54    },
55    content = function(file) {
56      write.csv(datasetInput(), file, row.names = FALSE)
57    }
58  )
59
60}
61
62# Create Shiny app ----
63shinyApp(ui, server)
参考
1、https://github.com/rstudio/shiny-examples

往期精彩:

公众号后台回复关键字即可学习
回复 爬虫 爬虫三大案例实战
回复 Python 1小时破冰入门
回复 数据挖掘 R语言入门及数据挖掘
回复 人工智能 三个月入门人工智能
回复 数据分析师 数据分析师成长之路
回复 机器学习 机器学习的商业应用
回复 数据科学 数据科学实战
回复 常用算法 常用数据挖掘算法