作者简介Introduction
taoyan:R语言中文社区特约作家,伪码农,R语言爱好者,爱开源。
个人博客: https://ytlogos.github.io/
公众号:生信大讲堂
简介
ggridges包主要用来绘制山峦图。尤其是针对时间或者空间分布份可视化具有十分好的效果。ggridges主要提供两个几何图像函数:
具体用法可以参考官方文档(https://cran.r-project.org/web/packages/ggridges/vignettes/introduction.html)
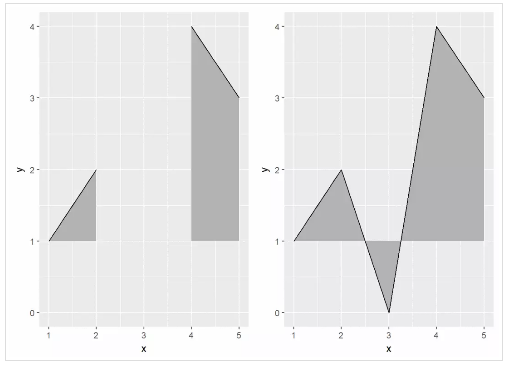
geom_ridgeline()
library(ggridges)
library(tidyverse)
library(gridExtra)
my_data <- data.frame(x=1:5, y=rep(1,5), height=c(0,1,-1,3,2))
plot_base <- ggplot(my_data, aes(x, y, height=height))
grid.arrange(plot_base+geom_ridgeline(),
plot_base+geom_ridgeline(min_height=-2), ncol=2)

geom_density_ridges()
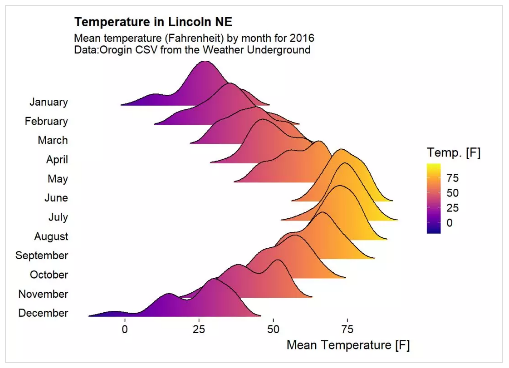
geom_density_ridges()函数首先会根据数据计算密度然后绘图,此时美学映射height没有必要写入函数中。下面使用lincoln_weather数据集。
library(viridis)
head(lincoln_weather[ ,1:4])
## # A tibble: 6 x 4
## CST `Max Temperature [F]` `Mean Temperature [F]` `Min Temperature ~
## <chr> <int> <int> <int>
## 1 2016-1-1 37 24 11
## 2 2016-1-2 41 23 5
## 3 2016-1-3 37 23 8
## 4 2016-1-4 30 17 4
## 5 2016-1-5 38 29 19
## 6 2016-1-6 34 33 32
ggplot(lincoln_weather, aes(x=`Mean Temperature [F]`, y=`Month`, fill=..x..))+
geom_density_ridges_gradient(scale=3, rel_min_height=0.01, gradient_lwd = 1.)+
scale_x_continuous(expand = c(0.01, 0))+
scale_y_discrete(expand = c(0.01,0))+
scale_fill_viridis(name="Temp. [F]", option = "C")+
labs(title="Temperature in Lincoln NE",subtitle="Mean temperature (Fahrenheit) by month for 2016\nData:Orogin CSV from the Weather Underground ")+
theme_ridges(font_size = 13, grid = FALSE)+
theme(axis.title.y = element_blank())
cyclinal scales
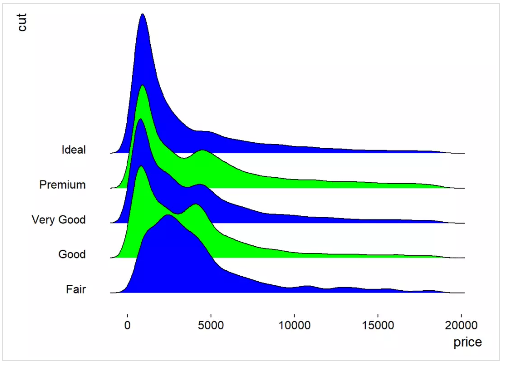
为了使得ggridges绘制的图形可视化效果最好,同时为了减少用户对颜色设置的困难,作者提供了cyclinal scales用于颜色轮转映射。
ggplot(diamonds, aes(x=price, y=cut, fill=cut))+
geom_density_ridges(scale=4)+
scale_fill_cyclical(values = c("blue", "green"))+
theme_ridges(grid = FALSE)
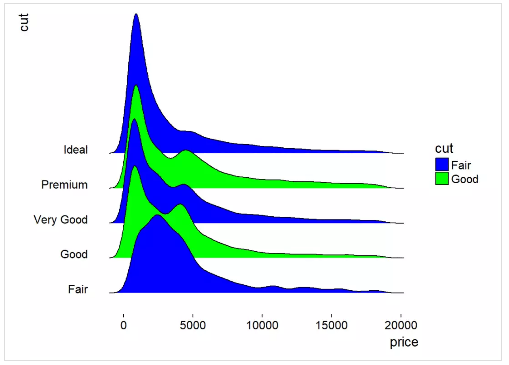
默认的,cyclinal scales为了防止误解是不绘制图例的,但是可以通过选项guide="legend"添加图例。
ggplot(diamonds, aes(x=price, y=cut, fill=cut))+
geom_density_ridges(scale=4)+
scale_fill_cyclical(values = c("blue", "green"), guide="legend")+
theme_ridges(grid = FALSE)
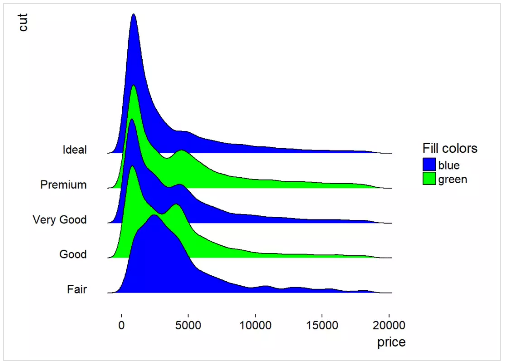
跟ggplot2一样,图例是可以修改的,其他参数比如大小、透明度、形状等都是可以通过cyclinal scales修改。
ggplot(diamonds, aes(x=price, y=cut, fill=cut))+
geom_density_ridges(scale=4)+
scale_fill_cyclical(values = c("blue", "green"), guide="legend",labels=c("Fair"="blue", "Good"="green"),name="Fill colors")+
theme_ridges(grid = FALSE)
还有很多用法有兴趣的可以查看官方文档继续学习。
SessionInfo
sessionInfo()
## R version 3.4.3 (2017-11-30)
## Platform: x86_64-w64-mingw32/x64 (64-bit)
## Running under: Windows 10 x64 (build 16299)
##
## Matrix products: default
##
## locale:
## [1] LC_COLLATE=Chinese (Simplified)_China.936
## [2] LC_CTYPE=Chinese (Simplified)_China.936
## [3] LC_MONETARY=Chinese (Simplified)_China.936
## [4] LC_NUMERIC=C
## [5] LC_TIME=Chinese (Simplified)_China.936
##
## attached base packages:
## [1] stats graphics grDevices utils datasets methods base
##
## other attached packages:
## [1] viridis_0.5.0 viridisLite_0.3.0 gridExtra_2.3
## [4] forcats_0.2.0 stringr_1.2.0 dplyr_0.7.4
## [7] purrr_0.2.4 readr_1.1.1 tidyr_0.8.0
## [10] tibble_1.4.2 tidyverse_1.2.1 ggridges_0.4.1.9990
## [13] ggplot2_2.2.1.9000
##
## loaded via a namespace (and not attached):
## [1] reshape2_1.4.3 haven_1.1.1 lattice_0.20-35
## [4] colorspace_1.3-2 htmltools_0.3.6 yaml_2.1.16
## [7] utf8_1.1.3 rlang_0.1.6 pillar_1.1.0
## [10] foreign_0.8-69 glue_1.2.0 modelr_0.1.1
## [13] readxl_1.0.0 bindrcpp_0.2 bindr_0.1
## [16] plyr_1.8.4 munsell_0.4.3 gtable_0.2.0
## [19] cellranger_1.1.0 rvest_0.3.2 psych_1.7.8
## [22] evaluate_0.10.1 labeling_0.3 knitr_1.19
## [25] parallel_3.4.3 broom_0.4.3 Rcpp_0.12.15
## [28] scales_0.5.0.9000 backports_1.1.2 jsonlite_1.5
## [31] mnormt_1.5-5 hms_0.4.1 digest_0.6.15
## [34] stringi_1.1.6 grid_3.4.3 rprojroot_1.3-2
## [37] cli_1.0.0 tools_3.4.3 magrittr_1.5
## [40] lazyeval_0.2.1 crayon_1.3.4 pkgconfig_2.0.1
## [43] xml2_1.2.0 lubridate_1.7.1 assertthat_0.2.0
## [46] rmarkdown_1.8 httr_1.3.1 rstudioapi_0.7
## [49] R6_2.2.2 nlme_3.1-131 compiler_3.4.3
往期精彩内容整理合集
2017年R语言发展报告(国内)
R语言中文社区历史文章整理(作者篇)
R语言中文社区历史文章整理(类型篇)
公众号后台回复关键字即可学习
回复 R R语言快速入门及数据挖掘
回复 Kaggle案例 Kaggle十大案例精讲(连载中)
回复 文本挖掘 手把手教你做文本挖掘
回复 可视化 R语言可视化在商务场景中的应用
回复 大数据 大数据系列免费视频教程
回复 量化投资 张丹教你如何用R语言量化投资
回复 用户画像 京东大数据,揭秘用户画像
回复 数据挖掘 常用数据挖掘算法原理解释与应用
回复 机器学习 人工智能系列之机器学习与实践
回复 爬虫 R语言爬虫实战案例分享