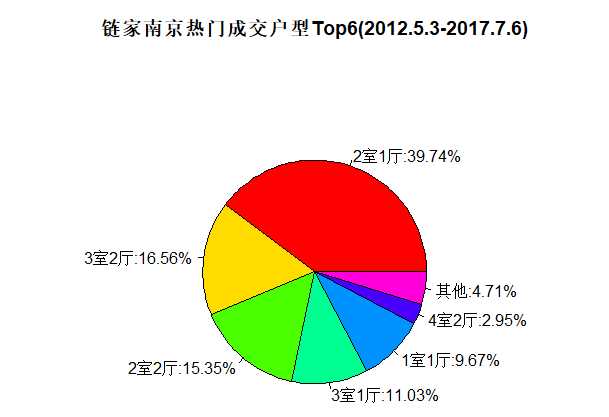
#链家南京热门成交户型Top6

layoutSaleAmount <- with(data, table(layout))

layoutSaleAmount <- sort(layoutSaleAmount, decreasing=TRUE)

topLayoutSaleAmount <- layoutSaleAmount[1:6]

topLayoutSaleAmount[7] <- sum(layoutSaleAmount)-sum(layoutSaleAmount[1:6])

names(topLayoutSaleAmount)[7] <- "其他"

pctTopLayoutSaleAmount <- round(topLayoutSaleAmount/sum(topLayoutSaleAmount)*100,2)

pctTopLayoutSaleAmount <- paste(names(topLayoutSaleAmount), ":", pctTopLayoutSaleAmount, "%", sep="")

par(mfrow=c(1,1))

pie(topLayoutSaleAmount, labels= pctTopLayoutSaleAmount, col=rainbow(length(topLayoutSaleAmount)),main="链家南京热门成交户型Top6(2012.5.3-2017.7.6)")
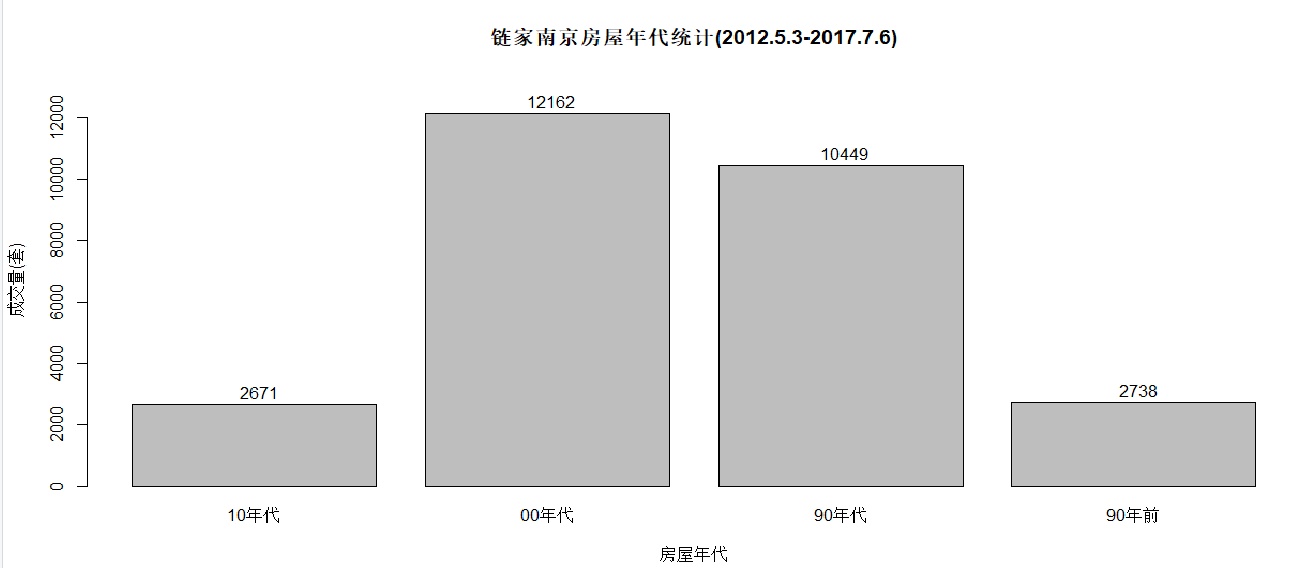
#链家南京房屋年代统计

data$years <- as.character(data$years)

data$years <- as.numeric(data$years)

data <- within(data, {

	hood <- NA

	hood[is.na(data$years)] <- NA

	hood[data$years<1990] <- "90年前"

	hood[data$years>=1990 & data$years<2000] <- "90年代"

	hood[data$years>=2000 & data$years<2010] <- "00年代"

	hood[data$years>=2010] <- "10年代"

})

data$hood <- ordered(data$hood, levels=c("10年代", "00年代", "90年代", "90年前"))

hoodSales <- with(data, table(hood))

barplot(hoodSales, xlab="房屋年代", ylab="成交量(套)",

ylim=c(0, max(hoodSales)*1.1), main="链家南京房屋年代统计(2012.5.3-2017.7.6)")

text(c(1:length(hoodSales))*1.2-0.48, hoodSales+400, hoodSales)
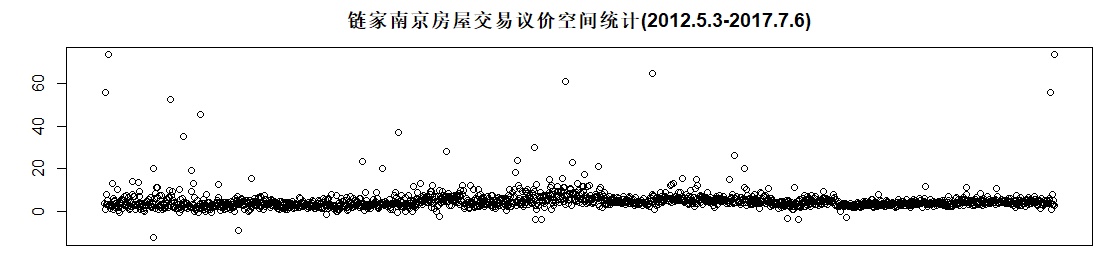
- 链家南京房屋交易议价空间统计(议价空间 = 挂牌价 - 成交价)
#5、议价空间 = 挂牌价 - 成交价

gapPrices <- data$quotedPrice - data$totalPrice

dayGapPrices <- aggregate(gapPrices, by=list(dealDate=data$dealDate), mean)

tsGapPrices=ts(dayGapPrices[2],frequency=365,start=c(2012,5,3),end=c(2017,7,6))

par(mfrow=c(2,1), mar=c(2,4,3,2))

plot.ts(tsGapPrices, type="p", xlab=NULL, xaxt="n", ylab=NULL, main="链家南京房屋交易议价空间统计(2012.5.3-2017.7.6)")

decTsGapPrices <- decompose(tsGapPrices)

par(mar=c(3,4,0,2))
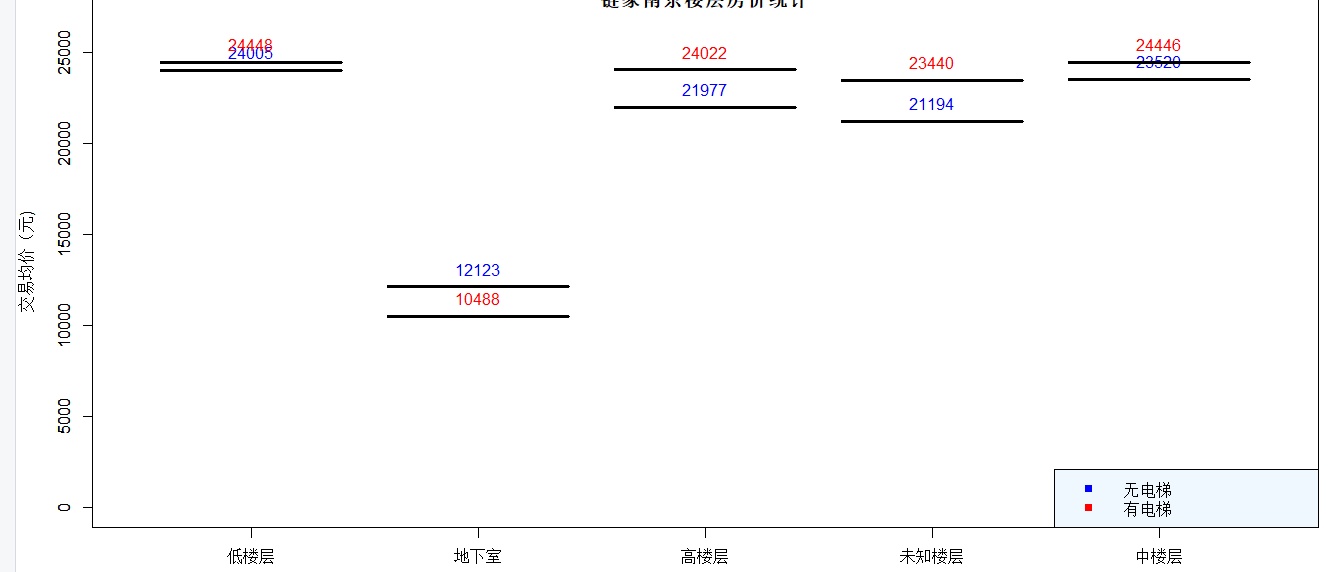
#楼层房价统计

data$loft <- as.character(data$loft)

data$loft <- as.numeric(data$loft)

# 无电梯房

elderdata <- data[data$elevator=="无电梯" | (is.na(data$elevator) & data$loft <= 7),]

# 有电梯房

newerdata <- data[!(data$elevator=="无电梯" | (is.na(data$elevator) & data$loft <= 7)),]

# 根据stair计算交易均价

stairElderPrices <- aggregate(elderdata$unitPrice, by=list(stair=elderdata$stair), mean)

stairNewerPrices <- aggregate(newerdata$unitPrice, by=list(stair=newerdata$stair), mean)

stairElderPrices[,2] <- round(stairElderPrices[,2], 0)

stairNewerPrices[,2] <- round(stairNewerPrices[,2], 0)

maxPrice <- max(stairElderPrices[,2],stairNewerPrices[,2])

plot(stairElderPrices[,1], stairElderPrices[,2], ylim=c(0, maxPrice*1.1), main="链家南京楼层房价统计",

type="b", col="blue", xlab="楼层", ylab="交易均价(元)")

text(stairElderPrices[,1], stairElderPrices[,2]+1000, stairElderPrices[,2], col="blue")

par(new=TRUE)

plot(stairElderPrices[,1], stairNewerPrices[,2], ylim=c(0, maxPrice*1.1),

type="b", col="red", xlab="楼层", ylab="交易均价(元)")

text(stairElderPrices[,1], stairNewerPrices[,2]+1000, stairNewerPrices[,2], col="red")

legend("bottomright", legend=c("无电梯","有电梯"), col=c("blue", "red"), bty="y", bg="aliceblue", pch=c(15,15))

par(new=FALSE)
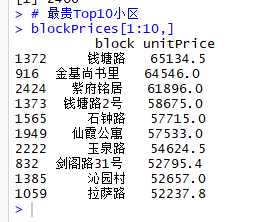
#7、最贵的top10小区

blockPrices <- aggregate(data$unitPrice, by=list(block=data$block), mean)

blockPrices <- blockPrices[order(blockPrices[,2], decreasing=TRUE),]

names(blockPrices)[2] <- "unitPrice"

# 小区总数

length(blockPrices[,1])

# 最贵Top10小区

blockPrices[1:10,]